
#tadawul #TASI #squeeze #pullback #downtrend
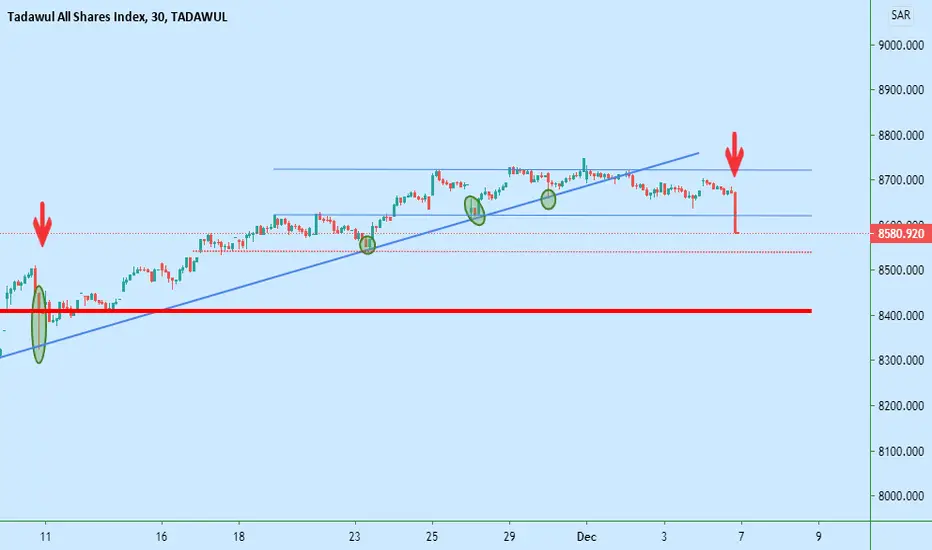
The red line identifies a probable zone of squeeze and pull back. If it is broken down, there is strong probability to see the price going down further.
The blue up trending line and the two other blue horizontal line helps you to get the story for a day trader on the TASI. After a super squeeze, the market price went up and then ranged for a while before losing some power and going under the up trending blue line. Later on we observed the price ranging and going down strongly with a very significant move. Probability of people taking profits all together. I might not be done yet. The rend zone down there is probably a pivot point. Decisions are to take from there.
Waiting for price movement and clear trend would be advantageous.
For the moment we have probability to see the price going down further, ! checkpoint being traced by the red dotted line.
The red line identifies a probable zone of squeeze and pull back. If it is broken down, there is strong probability to see the price going down further.
The blue up trending line and the two other blue horizontal line helps you to get the story for a day trader on the TASI. After a super squeeze, the market price went up and then ranged for a while before losing some power and going under the up trending blue line. Later on we observed the price ranging and going down strongly with a very significant move. Probability of people taking profits all together. I might not be done yet. The rend zone down there is probably a pivot point. Decisions are to take from there.
Waiting for price movement and clear trend would be advantageous.
For the moment we have probability to see the price going down further, ! checkpoint being traced by the red dotted line.

免责声明
这些信息和出版物并非旨在提供,也不构成TradingView提供或认可的任何形式的财务、投资、交易或其他类型的建议或推荐。请阅读使用条款了解更多信息。