
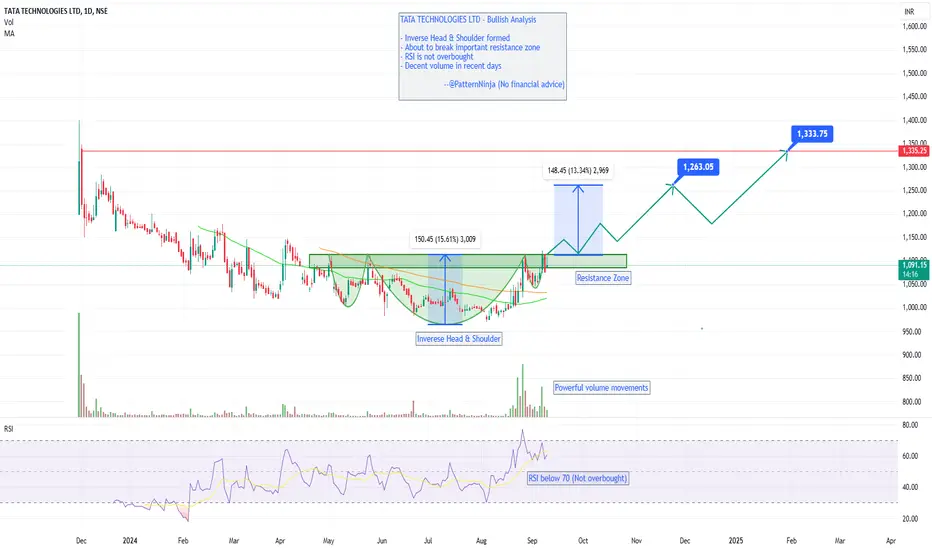
Bullish Analysis of TATA TECHNOLOGIES LTD
Key Observations:
1. Pattern Identified: Inverse Head & Shoulders
- The inverse head and shoulders pattern suggests a bullish reversal.
2. Resistance Zone:
- The stock is approaching a key resistance zone.
- A breakout above this zone could signal a strong upward movement.
3. Target Projections:
- If the breakout happens, the first target is set at ₹1,263, followed by ₹1,333.
4. Volume:
- Recent volume spikes indicate strong buying interest, supporting the potential breakout.
5. RSI:
- Currently at 60.91, it indicates strength, but still below the overbought zone, allowing room for upward movement.
Conclusion:
- Entry Point: A breakout above ₹1,093 can be a bullish signal.
- Targets: ₹1,263, ₹1,333.
- Risk: Watch for failure to break the resistance zone, which may signal a short-term pullback.
Follow us for STOP-LOSS updates.
Note: Always consider risk management and market conditions before making investment decisions.
Key Observations:
1. Pattern Identified: Inverse Head & Shoulders
- The inverse head and shoulders pattern suggests a bullish reversal.
2. Resistance Zone:
- The stock is approaching a key resistance zone.
- A breakout above this zone could signal a strong upward movement.
3. Target Projections:
- If the breakout happens, the first target is set at ₹1,263, followed by ₹1,333.
4. Volume:
- Recent volume spikes indicate strong buying interest, supporting the potential breakout.
5. RSI:
- Currently at 60.91, it indicates strength, but still below the overbought zone, allowing room for upward movement.
Conclusion:
- Entry Point: A breakout above ₹1,093 can be a bullish signal.
- Targets: ₹1,263, ₹1,333.
- Risk: Watch for failure to break the resistance zone, which may signal a short-term pullback.
Follow us for STOP-LOSS updates.
Note: Always consider risk management and market conditions before making investment decisions.

免责声明
这些信息和出版物并非旨在提供,也不构成TradingView提供或认可的任何形式的财务、投资、交易或其他类型的建议或推荐。请阅读使用条款了解更多信息。