
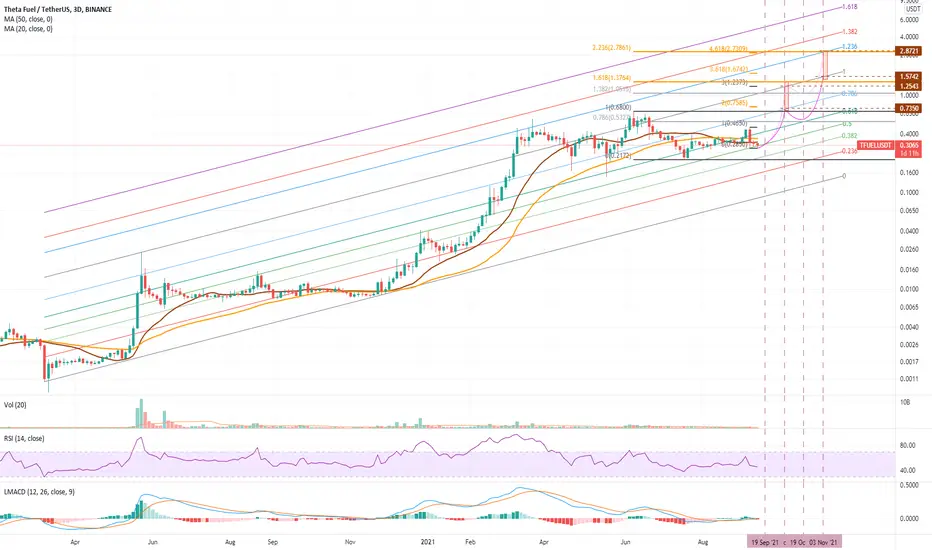
Re-running the TFUEL study in the Logarithmic scale and we see some clear and consistent structure to the market along the lines of a Fibonacci Channel.
Considering the completion of Wave 2 yesterday, this 3 Day Chart provides some insight and justification for higher targets for Wave 5.
Which do you think is more likely, the outcomes derived from previous Standard Scale chart or this Log Scale chart?
Considering the completion of Wave 2 yesterday, this 3 Day Chart provides some insight and justification for higher targets for Wave 5.
Which do you think is more likely, the outcomes derived from previous Standard Scale chart or this Log Scale chart?

免责声明
这些信息和出版物并非旨在提供,也不构成TradingView提供或认可的任何形式的财务、投资、交易或其他类型的建议或推荐。请阅读使用条款了解更多信息。