
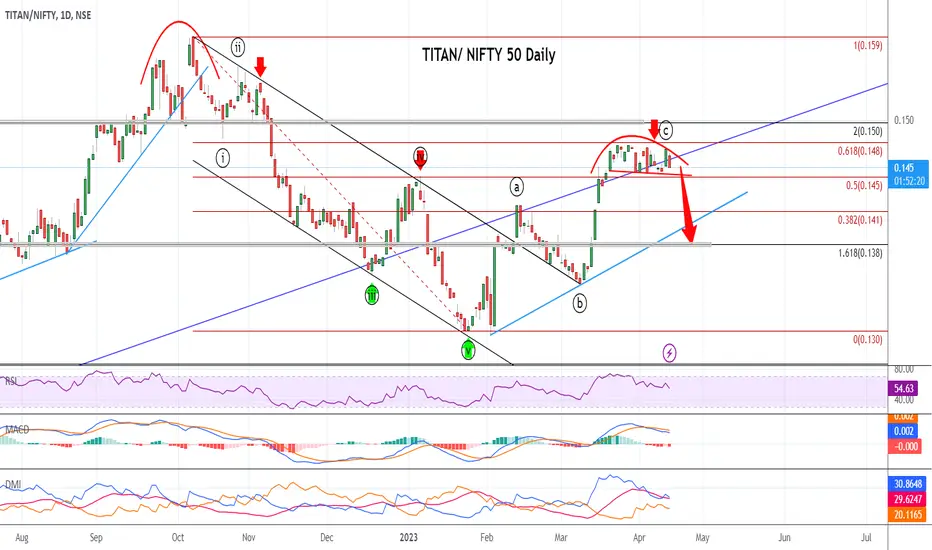
Attached: Titan/ Nifty 50 Daily Chart Live Market Hours as of 18th April 2023
The Ratio Chart signals that TITAN has completed Wave A/ 1 and done a retracement in Wave 2/ B and now the 3rd Wave/ C Wave Down is to Start
This implies that on a Relative Basis, TITAN is likely to MASSIVELY Underperform Nifty 50 Index
Today Titan is also One of the Top Losers from the Nifty 50 Index Top 20 Heavyweights
So as they Sell Weakness and Buy Strength
Hence, Look for Short Opportunities in Titan
The Ratio Chart signals that TITAN has completed Wave A/ 1 and done a retracement in Wave 2/ B and now the 3rd Wave/ C Wave Down is to Start
This implies that on a Relative Basis, TITAN is likely to MASSIVELY Underperform Nifty 50 Index
Today Titan is also One of the Top Losers from the Nifty 50 Index Top 20 Heavyweights
So as they Sell Weakness and Buy Strength
Hence, Look for Short Opportunities in Titan

Siddharth Bhansali
✔️Twitter Handle @T_Harth
✔️Twitter Handle @T_Harth
相关出版物
免责声明
这些信息和出版物并非旨在提供,也不构成TradingView提供或认可的任何形式的财务、投资、交易或其他类型的建议或推荐。请阅读使用条款了解更多信息。
Siddharth Bhansali
✔️Twitter Handle @T_Harth
✔️Twitter Handle @T_Harth
相关出版物
免责声明
这些信息和出版物并非旨在提供,也不构成TradingView提供或认可的任何形式的财务、投资、交易或其他类型的建议或推荐。请阅读使用条款了解更多信息。