Let's understand multi timeframe analysis for  TITAN.
Weekly TF -
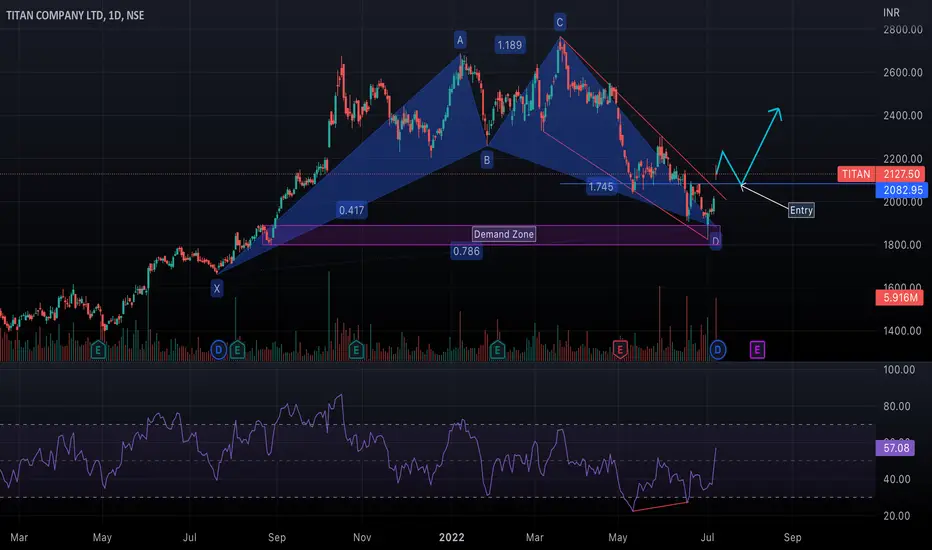
TITAN has been trading in a falling wedge pattern (LH-LL) and has recently re-tested a major demand zone. A bullish engulfing candlestick has been formed. There's an additional confluence of Harmonic Cypher PRZ around 1880.

Daily TF -
Bullish RSI divergence has been seen on daily TF. Price gaped up and did a breakout from a falling wedge structure. Short term bullish entry can be taken if price retraces back to 2080 level which was acting as a resistance earlier.

TITAN.Weekly TF -
TITAN has been trading in a falling wedge pattern (LH-LL) and has recently re-tested a major demand zone. A bullish engulfing candlestick has been formed. There's an additional confluence of Harmonic Cypher PRZ around 1880.Daily TF -
Bullish RSI divergence has been seen on daily TF. Price gaped up and did a breakout from a falling wedge structure. Short term bullish entry can be taken if price retraces back to 2080 level which was acting as a resistance earlier.
注释
Price reversed as per the analysis and moved higher.
免责声明
这些信息和出版物并非旨在提供,也不构成TradingView提供或认可的任何形式的财务、投资、交易或其他类型的建议或推荐。请阅读使用条款了解更多信息。
免责声明
这些信息和出版物并非旨在提供,也不构成TradingView提供或认可的任何形式的财务、投资、交易或其他类型的建议或推荐。请阅读使用条款了解更多信息。