
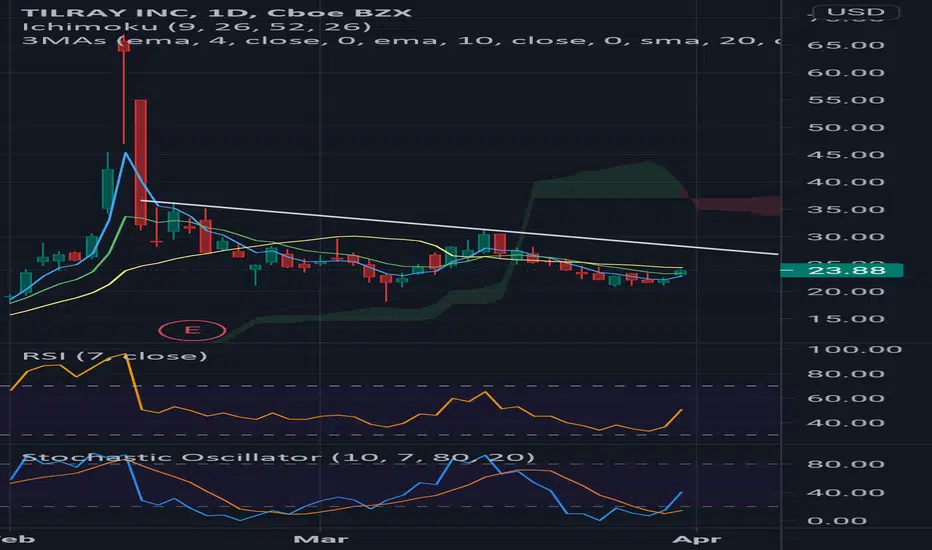
The chart is simple to read with RSI and stochastic both turning up. You can trade up to the blue line, even a day trade. Hold for break higher or reenter after line is broken, since there could be a pullback first or line may hold. For a longer hold I want to see moving averages cross up.
Risk is low because stops can be a certain price and/or a percentage of option loss. It depends on your trade. For example near today's open I bought weekly 24 calls for 50cents. I can use 22.99 and 22.80 as stops, and I can also exit if option goes below 0.40. These are initial stops that I may adjust as trade works.
Risk is low because stops can be a certain price and/or a percentage of option loss. It depends on your trade. For example near today's open I bought weekly 24 calls for 50cents. I can use 22.99 and 22.80 as stops, and I can also exit if option goes below 0.40. These are initial stops that I may adjust as trade works.

免责声明
这些信息和出版物并非旨在提供,也不构成TradingView提供或认可的任何形式的财务、投资、交易或其他类型的建议或推荐。请阅读使用条款了解更多信息。
免责声明
这些信息和出版物并非旨在提供,也不构成TradingView提供或认可的任何形式的财务、投资、交易或其他类型的建议或推荐。请阅读使用条款了解更多信息。