
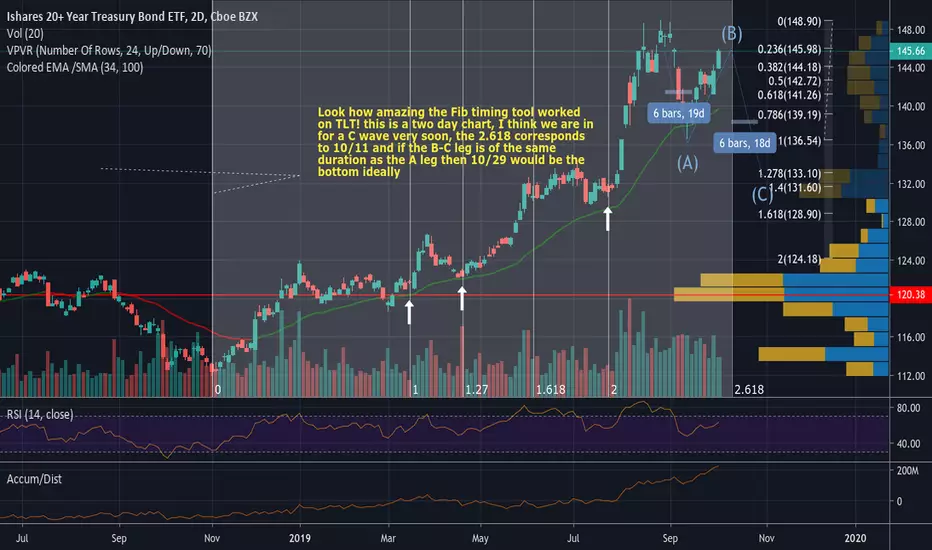
A question traders ask themselves a lot, especially options traders is WHEN exactly price will hit certain targets. By using a Fibonacci timing tool that uses a high as point 1, a second later high as point 2, and the low in between them as point 3, we can project Fibonacci extensions that indicate potential trend reversals, or in this case aggressive extensions of the existing trend to the upside in TLT. One can see from the arrows in this 2 day candlestick chart how accurately the tool has worked is the past but where are we now? I think we may have topped short term and are currently in the B leg of an ABC correction (this is invalidated by TLT making new highs). We may top in the B wave next week (10/11) and if the B-C leg of the correction is equal in duration to the A leg then 10/29 may mark the bottom in the 130s, that is another timing tool one can use for ABC corrective moves. Please ask any questions.

免责声明
这些信息和出版物并非旨在提供,也不构成TradingView提供或认可的任何形式的财务、投资、交易或其他类型的建议或推荐。请阅读使用条款了解更多信息。