
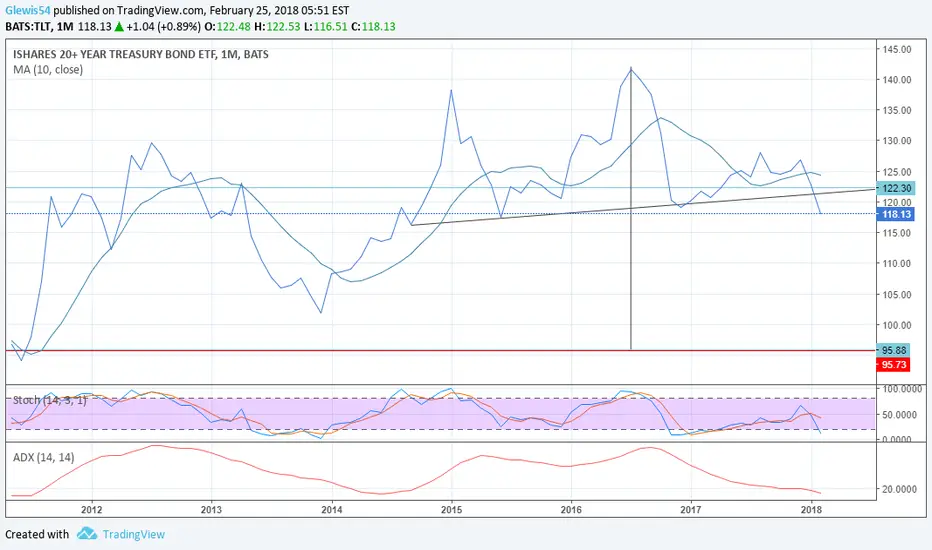
While a regular bar chart shows TLT holding firm at the neckline on a monthly chart, a simple line chart shows that TLT in fact has broken below the head and shoulders neck line. A rally to the neckline and subsequent failure indicates that price can fall below 100 over the long term

免责声明
这些信息和出版物并非旨在提供,也不构成TradingView提供或认可的任何形式的财务、投资、交易或其他类型的建议或推荐。请阅读使用条款了解更多信息。