做多
TNY update.
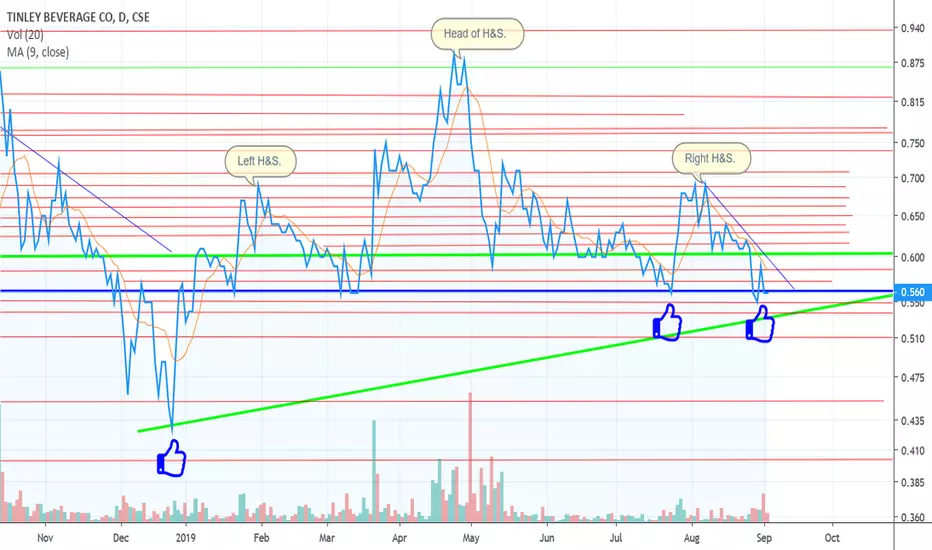
So, since the last time I posted a chart on TNY we were trading in descending triangle that broke to the downside on a "short term time frame." I had mentioned that the pattern could also be a bull flag, but that was not the case.
It is interesting however to see Tinley get back up to the 56c level where there seems to be historic support dating back to Aug 2018.
I can speculate all I want about where the share price may be in the future, but only time will tell per usual.
It is interesting however to see Tinley get back up to the 56c level where there seems to be historic support dating back to Aug 2018.
I can speculate all I want about where the share price may be in the future, but only time will tell per usual.

免责声明
这些信息和出版物并非旨在提供,也不构成TradingView提供或认可的任何形式的财务、投资、交易或其他类型的建议或推荐。请阅读使用条款了解更多信息。