
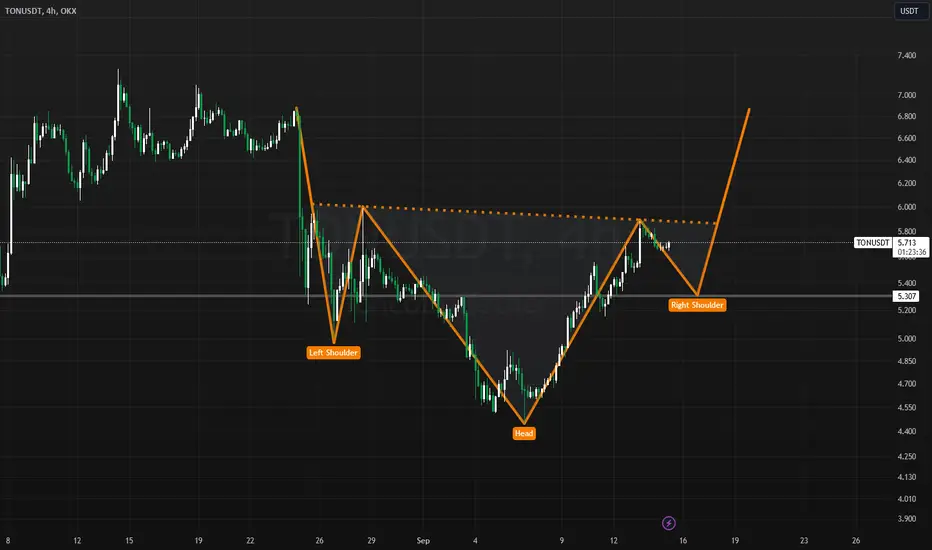
In the latest technical analysis, a bullish "Inverse Head and Shoulders" pattern has appeared. The price started at $6.8, dropping to $5 to form the left shoulder. It then rebounded to $6 before falling to a low of $4.4, marking the head. From there, the price surged back to $5.9, creating the right shoulder.
This pattern is often a strong indicator of a potential bullish reversal, signaling a possible upward move. Traders are now eagerly watching for a breakout above resistance levels, which could confirm the continuation of the uptrend. Will this be the beginning of a new rally?
The next price movement could set the stage for the market's short-term bullish momentum.
This pattern is often a strong indicator of a potential bullish reversal, signaling a possible upward move. Traders are now eagerly watching for a breakout above resistance levels, which could confirm the continuation of the uptrend. Will this be the beginning of a new rally?
The next price movement could set the stage for the market's short-term bullish momentum.

免责声明
这些信息和出版物并非旨在提供,也不构成TradingView提供或认可的任何形式的财务、投资、交易或其他类型的建议或推荐。请阅读使用条款了解更多信息。
免责声明
这些信息和出版物并非旨在提供,也不构成TradingView提供或认可的任何形式的财务、投资、交易或其他类型的建议或推荐。请阅读使用条款了解更多信息。