
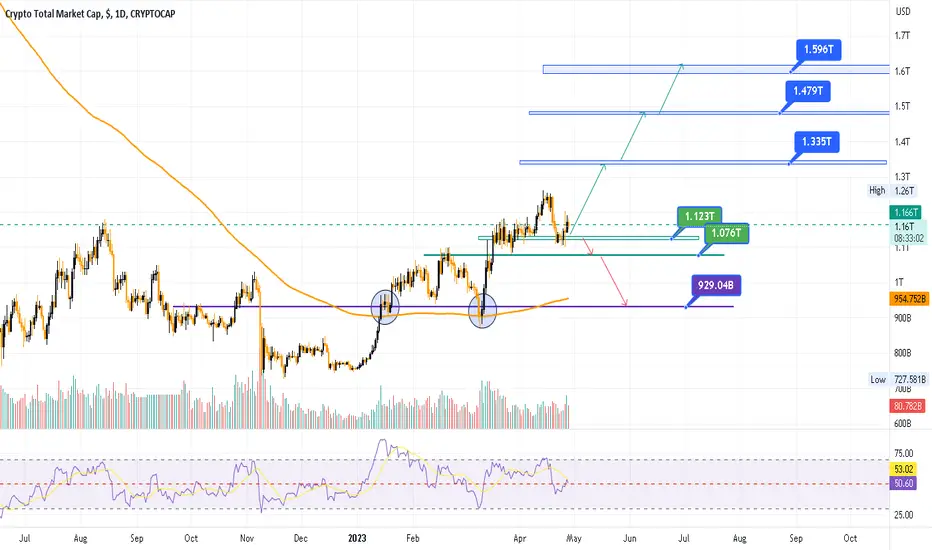
According to the total chart data, we will have two scenarios ahead:
The first scenario : Increase liquidity in the market
According to the chart data, we are now in a support area marked in green, if this area is maintained, we expect liquidity to increase to the blue areas.
Second scenario: decrease in liquidity
If the blue areas that act as support are lost, we will see liquidity fall to the purple area
My personal opinion:
Due to the failure of the average of two hundred days in the chart and its re-pullback
(blue circles), I predict that the first scenario will happen and increase the liquidity in the cryptocurrency market
A smart trade should always have appropriate solutions
Trade smartly
The first scenario : Increase liquidity in the market
According to the chart data, we are now in a support area marked in green, if this area is maintained, we expect liquidity to increase to the blue areas.
Second scenario: decrease in liquidity
If the blue areas that act as support are lost, we will see liquidity fall to the purple area
My personal opinion:
Due to the failure of the average of two hundred days in the chart and its re-pullback
(blue circles), I predict that the first scenario will happen and increase the liquidity in the cryptocurrency market
A smart trade should always have appropriate solutions
Trade smartly

免责声明
这些信息和出版物并非旨在提供,也不构成TradingView提供或认可的任何形式的财务、投资、交易或其他类型的建议或推荐。请阅读使用条款了解更多信息。