
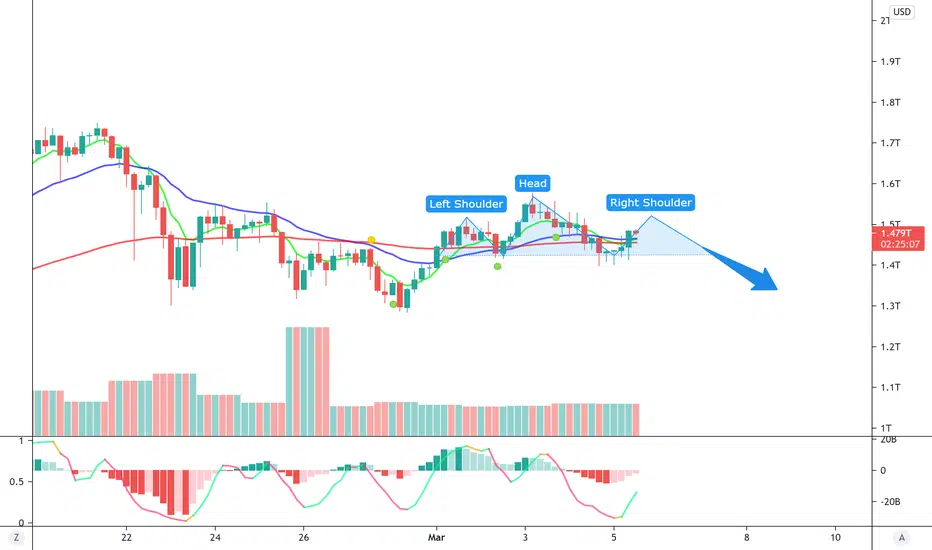
I can see a head and shoulders pattern forming looking at the Crypto Total Market Cap on the 4hr timeframe. There is also similar patterns going on with the BTC and ETH charts as well. The right shoulder on the BTC chart is approximately at the 50k mark. If we can see BTC holding above the 50k it will prove my head and shoulders theory was false. If not I see BTC dropping to the 40-42k range and the entire market cap revisiting the 1.2T mark. Last correction in mid January took approximately 22 days until the next run. Were about two weeks into this one. Again, my theory could be totally falsified and head the exact opposite direction. Crypto is at a big decision point so it's gonna make a move regardless. I'm with the bears on this one though.

免责声明
这些信息和出版物并非旨在提供,也不构成TradingView提供或认可的任何形式的财务、投资、交易或其他类型的建议或推荐。请阅读使用条款了解更多信息。