
Hi guys. I'm very proud of this analysis.
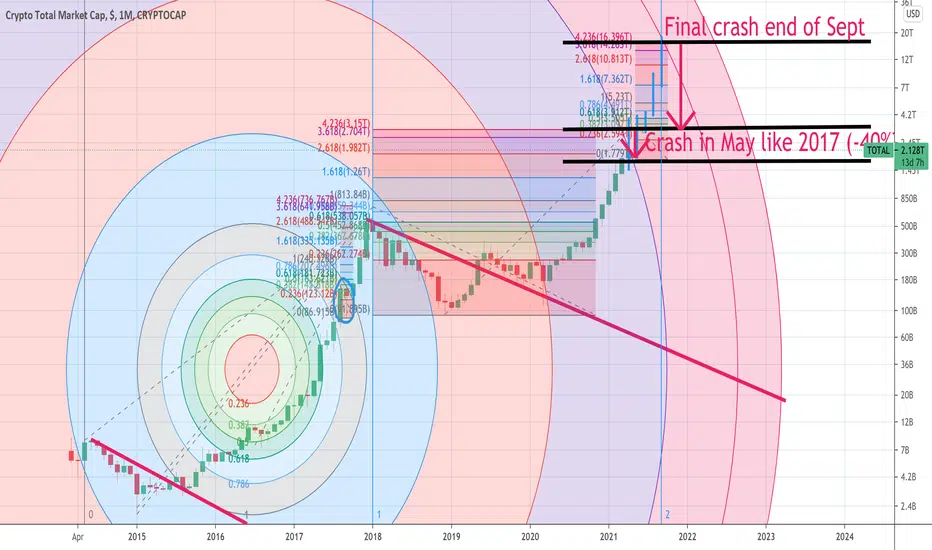
1) Based on the first macro Fibonacci extension and the fib circles, it looks likes we are approaching the next crash which will occur in May (-40%-45%?). This is exactly what happened in the previous cycles. The crypto market will go down once it reaches 3.2T$
However good news. This is not the end of the cycle.
2) Based on the second macro Fibonacci extension, the fib cycles, and the fib time zone, it looks like we will top out between the end of Aug and Sept. This is exactly what happened in the previous cycles. The crypto market will go crash once it reaches 17T$.
I'm not sure there will be a super cycle.
1) Based on the first macro Fibonacci extension and the fib circles, it looks likes we are approaching the next crash which will occur in May (-40%-45%?). This is exactly what happened in the previous cycles. The crypto market will go down once it reaches 3.2T$
However good news. This is not the end of the cycle.
2) Based on the second macro Fibonacci extension, the fib cycles, and the fib time zone, it looks like we will top out between the end of Aug and Sept. This is exactly what happened in the previous cycles. The crypto market will go crash once it reaches 17T$.
I'm not sure there will be a super cycle.
注释
[quick edit 1] The crash of May could be triggered once the crypto market reaches 2.7T$ too (3.618 Fibonacci). Therefore, let's say that the range for the crash could be between 2.7T$ and 3.2T$.(might be wrong but I'm pretty there has to be crash before the last pump.
[quick edit 2] The same for the final crash. It might be triggered at 14T$ (3.618 Fibonacci. Therefore, let me say that the range for the final crash could be between 14T and 17T$.
See you at the top
注释
The point I draw could be not super perfect! The crash/slow down could have already started in April and could continue in May? That makes sense --> we are at the 2.618 Fibonacci level.注释
This is a more targeted analysis for the market, excluding BTC --> alt coin market 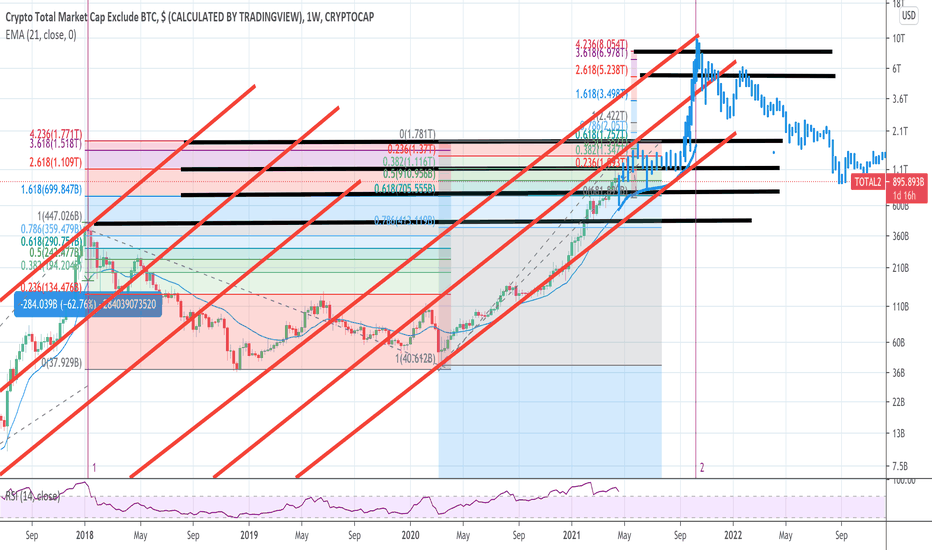
注释
This a more targeted analysis for the market, excluding ALT COINS --> BTC market 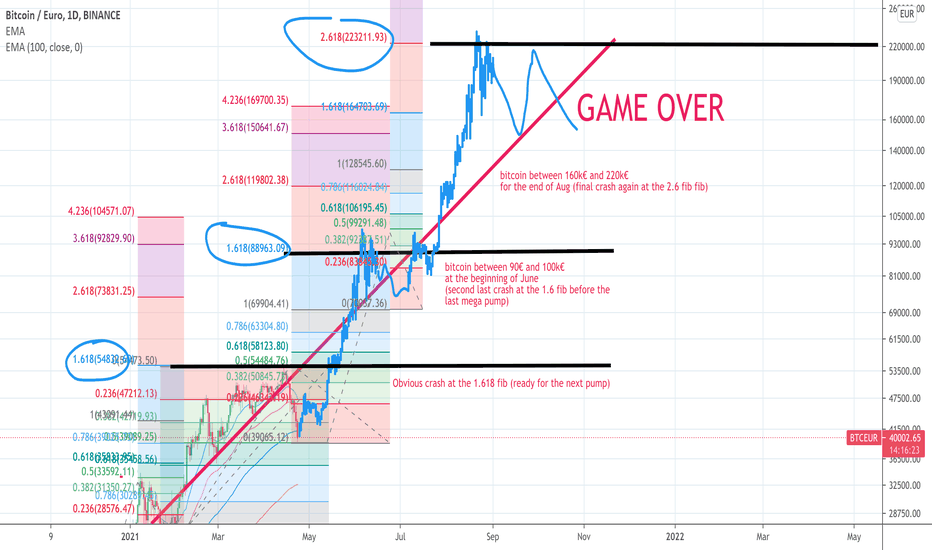
交易开始
We may need to transpose the top from Sept/Oct 2021 to April-June 2022 (last circle line). Of course, this timeframe does not follow the halving theory.
免责声明
这些信息和出版物并非旨在提供,也不构成TradingView提供或认可的任何形式的财务、投资、交易或其他类型的建议或推荐。请阅读使用条款了解更多信息。
免责声明
这些信息和出版物并非旨在提供,也不构成TradingView提供或认可的任何形式的财务、投资、交易或其他类型的建议或推荐。请阅读使用条款了解更多信息。