
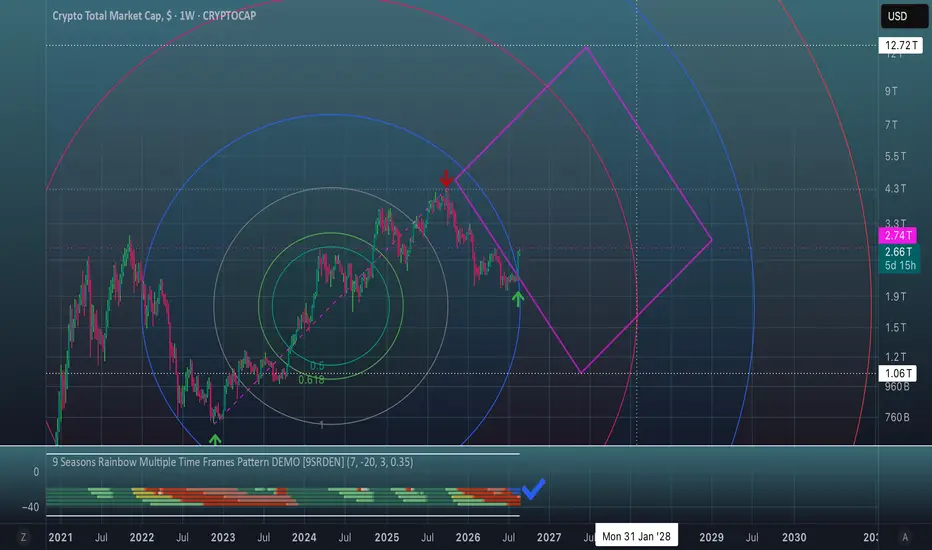
We’ll try applying Fibo circles to analyze the entire crypto market.
So, we have a fairly clear previous bottom in November 2022 and
a peak in September 2025.
Let’s overlay them…
There we go!
The impulse move that has just taken place bounced precisely off the 1.618 line.
This is a fairly clear sign that the structure is still intact. Therefore, starting from
the second green arrow, we can try to determine the ranges within which the market
may develop.
What we definitely don’t know is the angles of attack at individual points in time.
However, it would be correct to mark where, by date, the 1.618 level ends and
the 2.618 territory begins, because level transitions will most likely involve pauses,
pullbacks, and sideways movements.
So, with this setup, the 1.618 boundary falls at the end of January 2028.
I propose the following box. This is my original solution.
The upper side of the box clearly continues the 2022–2025 trend.
And its lower corner corresponds to the important $1.06T range,
where we observed significant accumulation in 2023, followed by growth.
So, here is the range of possible events for the next 1.5 years: $1.06T–$12.72T.
This does not mean that $12.72T will necessarily be reached.
It means that it is definitely impossible to go above this peak, because that would
essentially be a retest of the trend from below, and there would be a rejection there.
And one final observation: on the Rainbow 9 Seasons indicator, two timeframes have turned blue, indicating that the market has reached a state of strong oversold conditions. As soon as they turn green, the rally will have no trouble proving itself.
So, we have a fairly clear previous bottom in November 2022 and
a peak in September 2025.
Let’s overlay them…
There we go!
The impulse move that has just taken place bounced precisely off the 1.618 line.
This is a fairly clear sign that the structure is still intact. Therefore, starting from
the second green arrow, we can try to determine the ranges within which the market
may develop.
What we definitely don’t know is the angles of attack at individual points in time.
However, it would be correct to mark where, by date, the 1.618 level ends and
the 2.618 territory begins, because level transitions will most likely involve pauses,
pullbacks, and sideways movements.
So, with this setup, the 1.618 boundary falls at the end of January 2028.
I propose the following box. This is my original solution.
The upper side of the box clearly continues the 2022–2025 trend.
And its lower corner corresponds to the important $1.06T range,
where we observed significant accumulation in 2023, followed by growth.
So, here is the range of possible events for the next 1.5 years: $1.06T–$12.72T.
This does not mean that $12.72T will necessarily be reached.
It means that it is definitely impossible to go above this peak, because that would
essentially be a retest of the trend from below, and there would be a rejection there.
And one final observation: on the Rainbow 9 Seasons indicator, two timeframes have turned blue, indicating that the market has reached a state of strong oversold conditions. As soon as they turn green, the rally will have no trouble proving itself.

免责声明
这些信息和出版物并非旨在提供,也不构成TradingView提供或认可的任何形式的财务、投资、交易或其他类型的建议或推荐。请阅读使用条款了解更多信息。
免责声明
这些信息和出版物并非旨在提供,也不构成TradingView提供或认可的任何形式的财务、投资、交易或其他类型的建议或推荐。请阅读使用条款了解更多信息。