
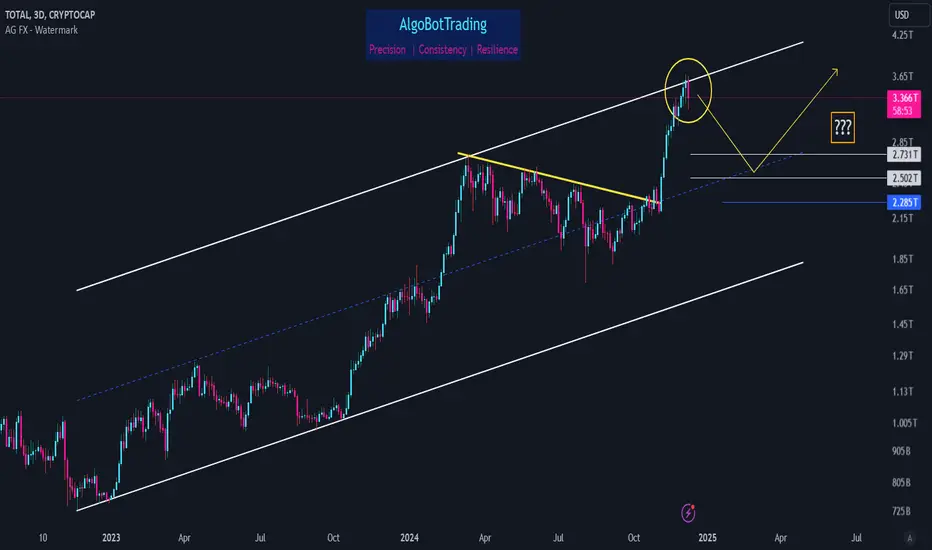
Sometimes a tool as simple as parallel channel can help us identify important support/resistance zones.
Looking at the chart, it's obvious that TOTAL reached 3.6T zone. Not only is this zone the area where a couple of fibs exist, but also it is indeed the upper boundary of the long term ascending channel.
Higher possibility scenario is to see a drop towards 2.5T - 2.73T zone before continuing the rally towards higher level. In order to keep its bullish integrity, TOTAL must not drop below 2.28T level.

免责声明
这些信息和出版物并非旨在提供,也不构成TradingView提供或认可的任何形式的财务、投资、交易或其他类型的建议或推荐。请阅读使用条款了解更多信息。
免责声明
这些信息和出版物并非旨在提供,也不构成TradingView提供或认可的任何形式的财务、投资、交易或其他类型的建议或推荐。请阅读使用条款了解更多信息。