
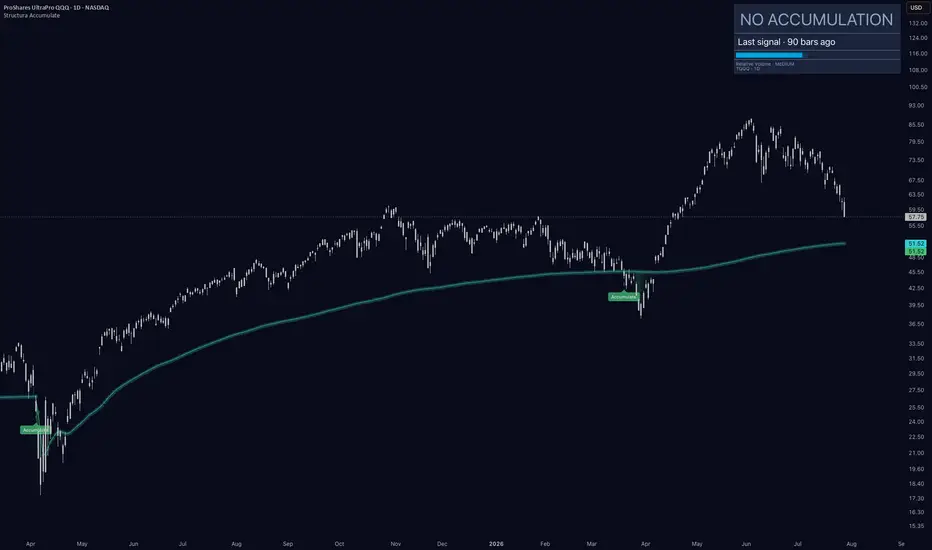
Structura Accumulate has been silent on TQQQ for 90 bars. In that stretch price roughly doubled from the low $40s to near $88, then gave back about 34% from that high. The reference line the tool draws now sits at 51.52, roughly 11% below the last close of 57.75 - and the chart has that unmistakable look: price heading toward a line that marked two lows before.
This Idea is about why that look is a trap, and what the honest read of this chart is today.
What the chart shows
Two zones since April 2025, eleven months apart. The first in April 2025, in the low $20s, where price was rebuilding around the adaptive low-anchored reference after a hard reset. The second in late March 2026, in the low $40s - that zone is the "last signal 90 bars ago" on the table. Between them, and after the second one, silence. Through the entire advance to $88: nothing.
That silence is not the tool failing to keep up. Accumulation is rebuilding behavior. It appears where a base is being built, not where a trend is extending, and a tool that found "accumulation" somewhere in the middle of that advance would have been describing noise.
Now the current bar, stated without flattering anything: it opened at 61.51, traded as high as 62.74, and closed at 57.75 - sixteen cents off its low. A wide-range day that closed on the floor. Relative volume reads MEDIUM: no capitulation spike, no quiet drift. The table says NO ACCUMULATION. So the tool sees a decline, and it does not yet see rebuilding.
"Approaching the line" is not a state
This is the point of the post, so it gets stated flatly.
The visible line is an adaptive low-anchored reference. It is not support. It is not a target. It is not an alert level. It is the anchor against which behavior is evaluated - and a zone prints when behavior around that anchor qualifies as rebuilding, not when price makes contact with it.
Two consequences that most readers have backwards:
So "price is 11% from the line" is a true sentence about distance and an empty sentence about structure. There is no half-signal here, no warming up, no approach. Either a zone prints or it does not.
The two-for-two problem
Both prior zones on this chart were followed by strong advances. That is the most seductive and least useful sample size in markets, and it deserves to be handled out loud rather than left to imply itself.
The honest accounting: two observations do not make a base rate. Both formed after deep resets inside the same broad regime, so they are not even independent tests of the same idea. And in both cases the zone identified a structural condition - price rebuilding around a long-anchored reference after a decline - while the magnitude of what followed belonged to the market, not to the tool. Zones can fail. A third zone, if one prints, inherits nothing from the first two except the mechanism that produced them.
If two past outcomes make you more confident about the next one rather than more careful, a structure lens has quietly turned into a story. We would rather name that than let the chart do the implying.
A leverage note, and it matters here
TQQQ is a 3x daily-reset instrument on the Nasdaq 100. Its structure is a leveraged, path-dependent rendering of another chart's structure, and that changes how every number above should be read.
The 11% gap between price and the reference corresponds to roughly a third of that move in the underlying index, before any compounding effects. The 34% drawdown from the June high is a far more ordinary decline upstairs. And because the instrument rebalances daily, a choppier path to the same index level leaves price somewhere else entirely - so this reference sits where this instrument's own history put it, not where the index's structure would put it.
Two implications. A zone on this chart is a statement about this chart's positioning behavior - not a view on the Nasdaq 100, and not a recommendation on either. And whatever a test of a zone eventually looks like here, it will be roughly three times louder than the same test upstairs, in both directions.
The observation protocol - in order
With no zone on the chart, the acceptance/rejection protocol does not apply yet. It cannot be run on a signal that does not exist. What applies is the step before it:
First question: does a zone print at all? Continued silence through further decline is information, not a delay. It would mean the tool does not see rebuilding behavior, however attractive the level looks on a screen.
If a zone prints, then and only then: acceptance - price stabilizes around the zone, reclaims the reference, structure holds. Or rejection - price fails through and moves away, and the rebuilding attempt is over. Weeks, not bars. On a 3x instrument, weeks that will feel considerably longer.
What not to do: treat 51.52 as an alert level and act on contact. That converts a behavioral tool into a horizontal line, which is exactly the thing it exists to replace. Review this chart when the tool speaks, not when price gets near a number.
The takeaway
Two zones since April 2025, then 90 bars of nothing while this chart completed a full round trip. Right now the tool is quiet through a 34% decline. That is not a malfunction - it is a structure tool declining to call a base before there is one.
The disciplined version of this chart fits in one sentence: no accumulation, reference at 51.52, decline in progress. Everything past that sentence is opinion, ours included. Wait for the tool to speak, then let the market answer.
Structura Accumulate is free and public - full framework in our profile.
This Idea is about why that look is a trap, and what the honest read of this chart is today.
What the chart shows
Two zones since April 2025, eleven months apart. The first in April 2025, in the low $20s, where price was rebuilding around the adaptive low-anchored reference after a hard reset. The second in late March 2026, in the low $40s - that zone is the "last signal 90 bars ago" on the table. Between them, and after the second one, silence. Through the entire advance to $88: nothing.
That silence is not the tool failing to keep up. Accumulation is rebuilding behavior. It appears where a base is being built, not where a trend is extending, and a tool that found "accumulation" somewhere in the middle of that advance would have been describing noise.
Now the current bar, stated without flattering anything: it opened at 61.51, traded as high as 62.74, and closed at 57.75 - sixteen cents off its low. A wide-range day that closed on the floor. Relative volume reads MEDIUM: no capitulation spike, no quiet drift. The table says NO ACCUMULATION. So the tool sees a decline, and it does not yet see rebuilding.
"Approaching the line" is not a state
This is the point of the post, so it gets stated flatly.
The visible line is an adaptive low-anchored reference. It is not support. It is not a target. It is not an alert level. It is the anchor against which behavior is evaluated - and a zone prints when behavior around that anchor qualifies as rebuilding, not when price makes contact with it.
Two consequences that most readers have backwards:
- Price can trade straight through the line and print nothing. Distance to the line is arithmetic. A zone is a behavioral read.
- Price can print a zone without a clean touch, or from underneath. On TSLA a few days ago, the first test of a fresh zone opened with the close below the reference. Contact is not the mechanism.
So "price is 11% from the line" is a true sentence about distance and an empty sentence about structure. There is no half-signal here, no warming up, no approach. Either a zone prints or it does not.
The two-for-two problem
Both prior zones on this chart were followed by strong advances. That is the most seductive and least useful sample size in markets, and it deserves to be handled out loud rather than left to imply itself.
The honest accounting: two observations do not make a base rate. Both formed after deep resets inside the same broad regime, so they are not even independent tests of the same idea. And in both cases the zone identified a structural condition - price rebuilding around a long-anchored reference after a decline - while the magnitude of what followed belonged to the market, not to the tool. Zones can fail. A third zone, if one prints, inherits nothing from the first two except the mechanism that produced them.
If two past outcomes make you more confident about the next one rather than more careful, a structure lens has quietly turned into a story. We would rather name that than let the chart do the implying.
A leverage note, and it matters here
TQQQ is a 3x daily-reset instrument on the Nasdaq 100. Its structure is a leveraged, path-dependent rendering of another chart's structure, and that changes how every number above should be read.
The 11% gap between price and the reference corresponds to roughly a third of that move in the underlying index, before any compounding effects. The 34% drawdown from the June high is a far more ordinary decline upstairs. And because the instrument rebalances daily, a choppier path to the same index level leaves price somewhere else entirely - so this reference sits where this instrument's own history put it, not where the index's structure would put it.
Two implications. A zone on this chart is a statement about this chart's positioning behavior - not a view on the Nasdaq 100, and not a recommendation on either. And whatever a test of a zone eventually looks like here, it will be roughly three times louder than the same test upstairs, in both directions.
The observation protocol - in order
With no zone on the chart, the acceptance/rejection protocol does not apply yet. It cannot be run on a signal that does not exist. What applies is the step before it:
First question: does a zone print at all? Continued silence through further decline is information, not a delay. It would mean the tool does not see rebuilding behavior, however attractive the level looks on a screen.
If a zone prints, then and only then: acceptance - price stabilizes around the zone, reclaims the reference, structure holds. Or rejection - price fails through and moves away, and the rebuilding attempt is over. Weeks, not bars. On a 3x instrument, weeks that will feel considerably longer.
What not to do: treat 51.52 as an alert level and act on contact. That converts a behavioral tool into a horizontal line, which is exactly the thing it exists to replace. Review this chart when the tool speaks, not when price gets near a number.
The takeaway
Two zones since April 2025, then 90 bars of nothing while this chart completed a full round trip. Right now the tool is quiet through a 34% decline. That is not a malfunction - it is a structure tool declining to call a base before there is one.
The disciplined version of this chart fits in one sentence: no accumulation, reference at 51.52, decline in progress. Everything past that sentence is opinion, ours included. Wait for the tool to speak, then let the market answer.
Structura Accumulate is free and public - full framework in our profile.

Market structure intelligence. We map process, not predictions - structure, momentum, and trend in one disciplined read. No standalone buy/sell signals. structuramarkets.com
免责声明
这些信息和出版物并非旨在提供,也不构成TradingView提供或认可的任何形式的财务、投资、交易或其他类型的建议或推荐。请阅读使用条款了解更多信息。
Market structure intelligence. We map process, not predictions - structure, momentum, and trend in one disciplined read. No standalone buy/sell signals. structuramarkets.com
免责声明
这些信息和出版物并非旨在提供,也不构成TradingView提供或认可的任何形式的财务、投资、交易或其他类型的建议或推荐。请阅读使用条款了解更多信息。