
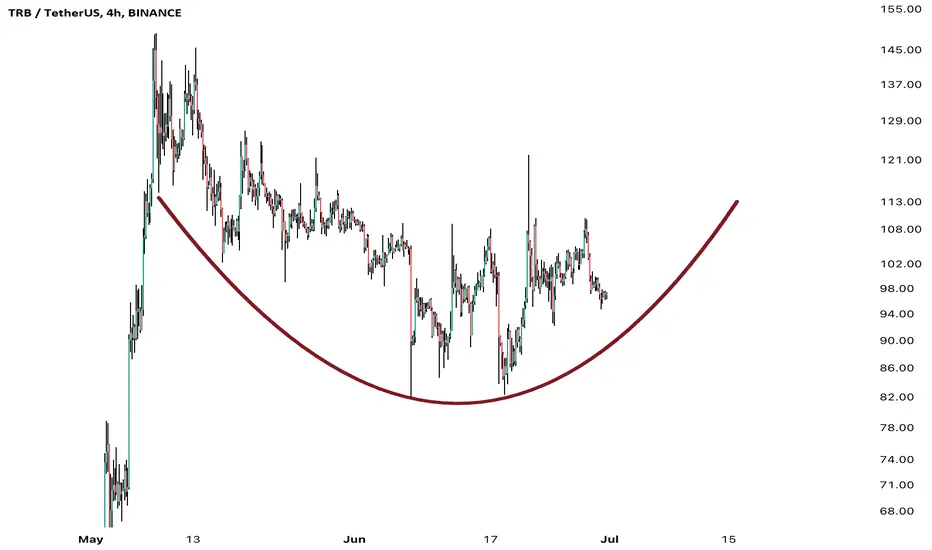
Our algorithms identified a bearish Ichimoku signal for  TRB on the 4H chart. The signal indicates a 4%-5% setback.
Here are the details 👇
TRB printed an Ichimoku signal on the 4H chart. The signal combines various Ichimoku indicators and validates the direction on higher timeframes. As a result, it is considered highly reliable.
Backtest Details 🧐
The signal has solid backtest results. Based on 7 historical signals, TRB dipped over 5% after signals flashed in 72% of their occurrence.
Other Technical Indicators 💹
Trend indicators are mainly bearish, whereas momentum indicators show a mixed picture.
What about the chart 📊
TRB is currently showing an uptrend after forming a bottom in early/mid-June. Therefore, based on the chart, a further price increase is likely. However, the Ichimoku price target perfectly fits the U-shape.
As a result, a possible scenario could be another retest of the U-shape before TRB continues going higher.
TRB on the 4H chart. The signal indicates a 4%-5% setback.Here are the details 👇
TRB printed an Ichimoku signal on the 4H chart. The signal combines various Ichimoku indicators and validates the direction on higher timeframes. As a result, it is considered highly reliable.
Backtest Details 🧐
The signal has solid backtest results. Based on 7 historical signals, TRB dipped over 5% after signals flashed in 72% of their occurrence.
Other Technical Indicators 💹
Trend indicators are mainly bearish, whereas momentum indicators show a mixed picture.
What about the chart 📊
TRB is currently showing an uptrend after forming a bottom in early/mid-June. Therefore, based on the chart, a further price increase is likely. However, the Ichimoku price target perfectly fits the U-shape.
As a result, a possible scenario could be another retest of the U-shape before TRB continues going higher.

免责声明
这些信息和出版物并非旨在提供,也不构成TradingView提供或认可的任何形式的财务、投资、交易或其他类型的建议或推荐。请阅读使用条款了解更多信息。
免责声明
这些信息和出版物并非旨在提供,也不构成TradingView提供或认可的任何形式的财务、投资、交易或其他类型的建议或推荐。请阅读使用条款了解更多信息。