
Hello people,
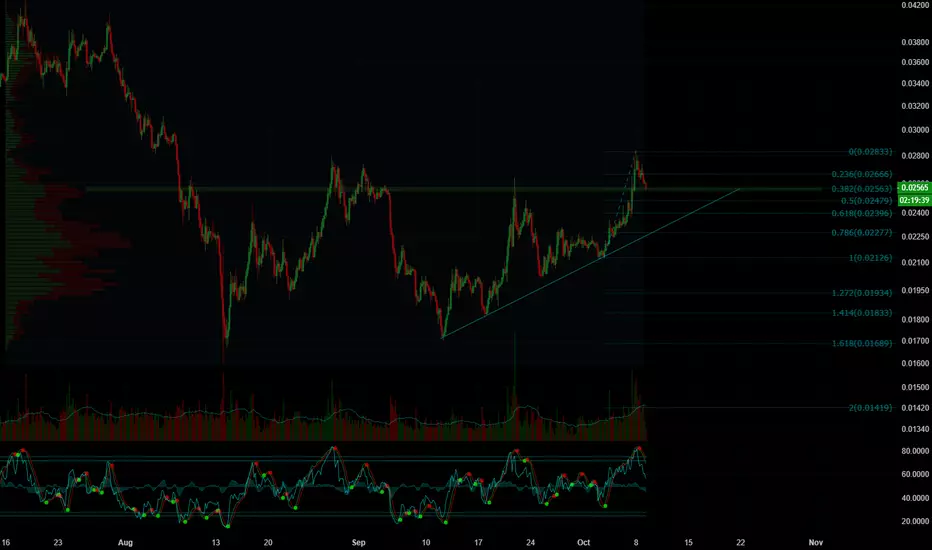
As we can see on the chart, TRX had a massive bullish impulse, but again got rejected from the same resistance.
We can see the picture more clearly on the daily time chart:

Current price is testing 0.382 Fibonacci retracements of the last bullish impulse. This level is also important because it was the last higher high TRON managed to break on a smaller timeframe. If the bulls manage to hold these prices we can soon expect another attempt towards higher high on daily. This scenario would be very bullish.
On TRX/BTC chart TRON looks very good:

It broke massively from the iH&S structure and is now retesting the neckline. If the bulls manage to hold that support line we can expect a huge move to the upside:

Be patient and trade safely.
As we can see on the chart, TRX had a massive bullish impulse, but again got rejected from the same resistance.
We can see the picture more clearly on the daily time chart:
Current price is testing 0.382 Fibonacci retracements of the last bullish impulse. This level is also important because it was the last higher high TRON managed to break on a smaller timeframe. If the bulls manage to hold these prices we can soon expect another attempt towards higher high on daily. This scenario would be very bullish.
On TRX/BTC chart TRON looks very good:
It broke massively from the iH&S structure and is now retesting the neckline. If the bulls manage to hold that support line we can expect a huge move to the upside:
Be patient and trade safely.

免责声明
这些信息和出版物并非旨在提供,也不构成TradingView提供或认可的任何形式的财务、投资、交易或其他类型的建议或推荐。请阅读使用条款了解更多信息。