
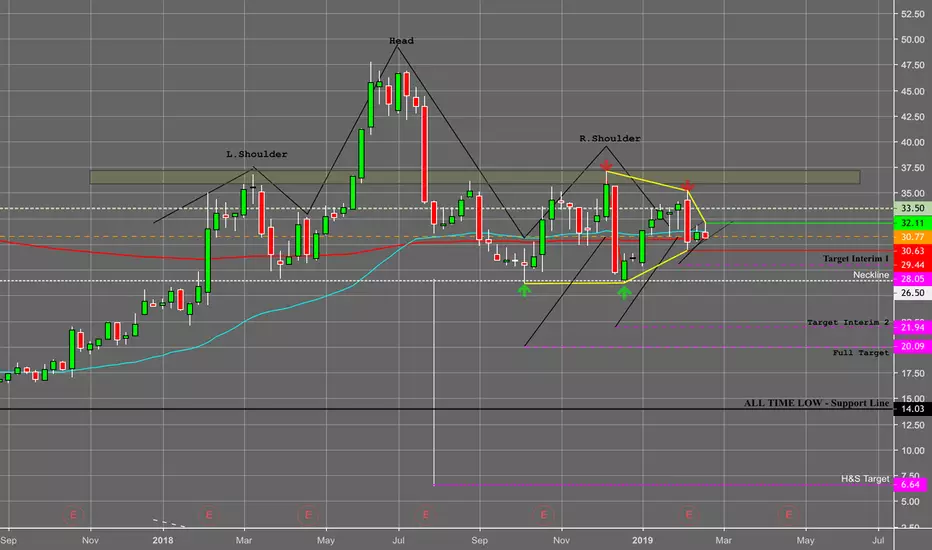
Twitter has been setting up a couple pretty strong bear patterns.
There is a nice forming H&S pattern with the right shoulder forming a low slung triangle pattern with the down-leg candles strong the the up-leg for the triangle and also the H&S pattern.
Moving averages has also decided to cross bearish with price action showing below it. The 100 EMA on the week looks to be the only support looking to support Twitter which happens to be around the red line drawn. Might have a little support from that. Once that breaks, no real strong support until
about $14 (All time low)
Possible short @ $29.44
Stop Loss $32.11
Taking most profit around Int 2.
There is a nice forming H&S pattern with the right shoulder forming a low slung triangle pattern with the down-leg candles strong the the up-leg for the triangle and also the H&S pattern.
Moving averages has also decided to cross bearish with price action showing below it. The 100 EMA on the week looks to be the only support looking to support Twitter which happens to be around the red line drawn. Might have a little support from that. Once that breaks, no real strong support until
about $14 (All time low)
Possible short @ $29.44
Stop Loss $32.11
Taking most profit around Int 2.
交易手动结束
This has negated the H&S theory I had for this trend and is showing strength. Tech sector looks fairly strong
免责声明
这些信息和出版物并非旨在提供,也不构成TradingView提供或认可的任何形式的财务、投资、交易或其他类型的建议或推荐。请阅读使用条款了解更多信息。
免责声明
这些信息和出版物并非旨在提供,也不构成TradingView提供或认可的任何形式的财务、投资、交易或其他类型的建议或推荐。请阅读使用条款了解更多信息。