UK 100 ( UK100) Daily: All-Time High Test at 10,948 — Genuine Breakout Retest vs. Institutional Bull Trap (Two-Way Matrix)
### 🇬🇧 FTSE 100 Index (UK100) Daily Technical Framework (Ref: UK100_2026-07-30_08-57-56.png)
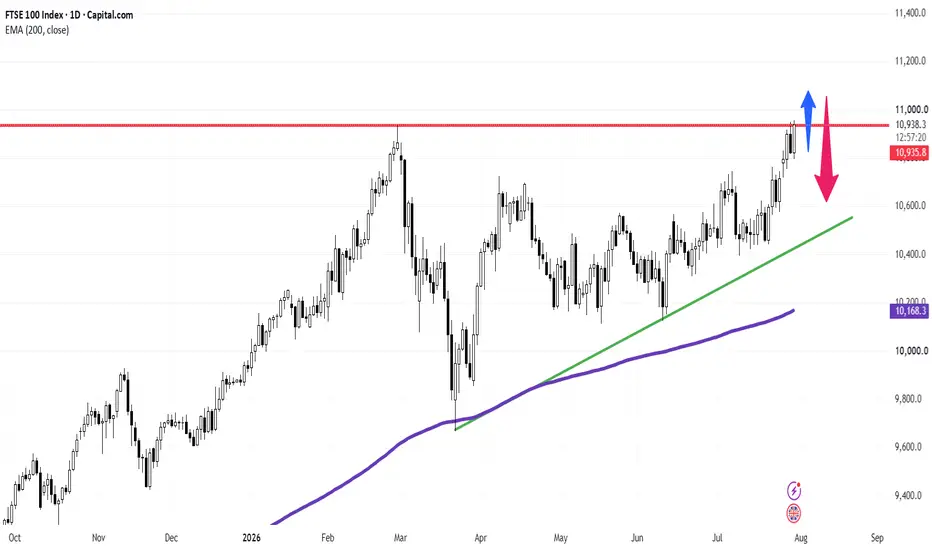
We are deploying a strategic daily (1D) structural framework on the UK FTSE 100 Index (UK100). The benchmark index is currently pressing directly against its all-time high resistance barrier, setting up a high-volatility decision node between genuine trend expansion and an institutional liquidity sweep.
The index is trading with strong bullish momentum today at **10,948.0 (+1.15%)**, testing the major horizontal resistance ceiling at **10,935.8 – 10,948.0**.
---
### 🔍 Market Microstructure & Dual-Path Dynamics:
Testing record territory creates a textbook junction between retail breakout mechanics and institutional liquidity hunting:
1. **Scenario A — Genuine Breakout & Retest (Blue Vector):**
* **Mechanics:** The ideal bullish scenario requires a decisive daily close above the **10,948.0** historical pivot. A subsequent controlled pullback (*throwback*) that holds the breakout level as new support, followed by a strong expansion candle, validates the trend continuation toward the **11,000+** psychological threshold.
2. **Scenario B — Institutional Bull Trap / Liquidity Sweep (Red Vector):**
* **Mechanics:** Institutional market makers often push price temporarily above key record levels to trigger retail buy-stops and stop-loss orders. If aggressive sell-side supply immediately absorbs this demand and closes the daily candle back below **10,935.8**, a sharp rejection (*fakeout*) will follow, driving a corrective leg toward the ascending trendline support (green LTA baseline) and the **10,168.4** 200-EMA.
---
### 🛡️ Tactical Risk Management Protocol:
At historical inflection points, waiting for daily candle close confirmation is essential to align with high-probability positioning:
* **Overhead Resistance Pivot:** 10,935.8 – 10,948.0 (All-Time High Ceiling)
* **Bullish Expansion Trigger:** Daily close above 10,948.0 followed by a successful throwback hold.
* **Bearish Rejection Trigger:** Daily close below 10,935.8 with long upper rejection wick.
* **Macro Baseline Floor:** Ascending green trendline & 10,168.4 (200-EMA Anchor).
### 📊 Tactical Parameters Summary:
* **Current Bias:** Neutral / Awaiting Daily Close Confirmation
* **Critical Resistance Ceiling:** 10,948.0
* **Upside Expansion Target:** 11,000.0+
* **Downside Rejection Target:** Ascending LTA Baseline (~10,500.0)
* **Institutional Trend Floor:** 10,168.4 (200-EMA)
---
📊 **ChartPro Data**
*UK Equity Architecture, Breakout Microstructure & Systematic Risk Management.*
⚠️ **Disclaimer:** For educational and informational purposes only. This active market study represents a personal trading framework and does not constitute financial or investment advice.
UK100) Daily: All-Time High Test at 10,948 — Genuine Breakout Retest vs. Institutional Bull Trap (Two-Way Matrix)### 🇬🇧 FTSE 100 Index (
UK100) Daily Technical Framework (Ref: UK100_2026-07-30_08-57-56.png)We are deploying a strategic daily (1D) structural framework on the UK FTSE 100 Index (
UK100). The benchmark index is currently pressing directly against its all-time high resistance barrier, setting up a high-volatility decision node between genuine trend expansion and an institutional liquidity sweep.The index is trading with strong bullish momentum today at **10,948.0 (+1.15%)**, testing the major horizontal resistance ceiling at **10,935.8 – 10,948.0**.
---
### 🔍 Market Microstructure & Dual-Path Dynamics:
Testing record territory creates a textbook junction between retail breakout mechanics and institutional liquidity hunting:
1. **Scenario A — Genuine Breakout & Retest (Blue Vector):**
* **Mechanics:** The ideal bullish scenario requires a decisive daily close above the **10,948.0** historical pivot. A subsequent controlled pullback (*throwback*) that holds the breakout level as new support, followed by a strong expansion candle, validates the trend continuation toward the **11,000+** psychological threshold.
2. **Scenario B — Institutional Bull Trap / Liquidity Sweep (Red Vector):**
* **Mechanics:** Institutional market makers often push price temporarily above key record levels to trigger retail buy-stops and stop-loss orders. If aggressive sell-side supply immediately absorbs this demand and closes the daily candle back below **10,935.8**, a sharp rejection (*fakeout*) will follow, driving a corrective leg toward the ascending trendline support (green LTA baseline) and the **10,168.4** 200-EMA.
---
### 🛡️ Tactical Risk Management Protocol:
At historical inflection points, waiting for daily candle close confirmation is essential to align with high-probability positioning:
* **Overhead Resistance Pivot:** 10,935.8 – 10,948.0 (All-Time High Ceiling)
* **Bullish Expansion Trigger:** Daily close above 10,948.0 followed by a successful throwback hold.
* **Bearish Rejection Trigger:** Daily close below 10,935.8 with long upper rejection wick.
* **Macro Baseline Floor:** Ascending green trendline & 10,168.4 (200-EMA Anchor).
### 📊 Tactical Parameters Summary:
* **Current Bias:** Neutral / Awaiting Daily Close Confirmation
* **Critical Resistance Ceiling:** 10,948.0
* **Upside Expansion Target:** 11,000.0+
* **Downside Rejection Target:** Ascending LTA Baseline (~10,500.0)
* **Institutional Trend Floor:** 10,168.4 (200-EMA)
---
📊 **ChartPro Data**
*UK Equity Architecture, Breakout Microstructure & Systematic Risk Management.*
⚠️ **Disclaimer:** For educational and informational purposes only. This active market study represents a personal trading framework and does not constitute financial or investment advice.

免责声明
这些信息和出版物并非旨在提供,也不构成TradingView提供或认可的任何形式的财务、投资、交易或其他类型的建议或推荐。请阅读使用条款了解更多信息。
免责声明
这些信息和出版物并非旨在提供,也不构成TradingView提供或认可的任何形式的财务、投资、交易或其他类型的建议或推荐。请阅读使用条款了解更多信息。