
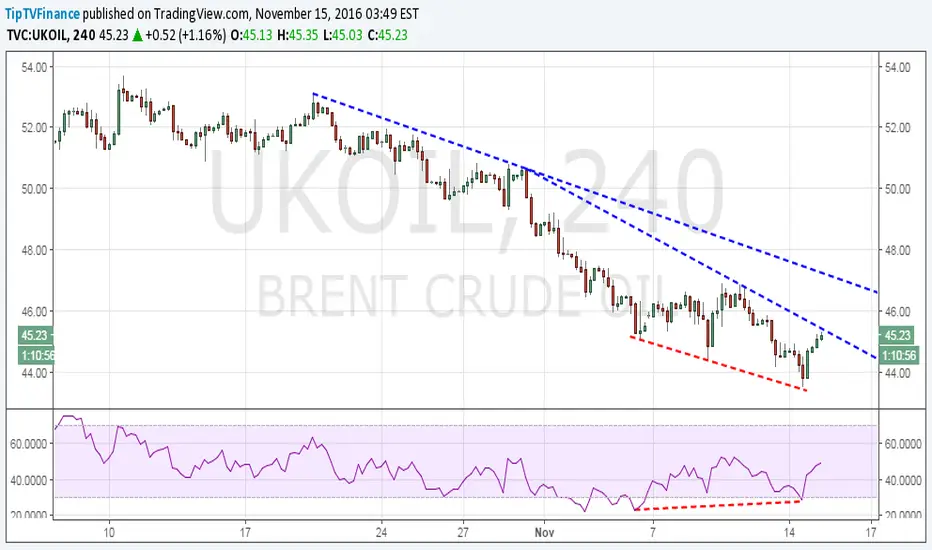
The 4-hour chart shows a bullish price RSI divergence followed by a rise to the descending trend line hurdle.
Oil bulls now await a breach of the trend line hurdle, following which the prices could rise to $46.90 (larger descending trend line hurdle)
On the other hand, a repeated failure to take out trend line hurdle would open doors for a revisit to a recent low of $43.55.
Oil bulls now await a breach of the trend line hurdle, following which the prices could rise to $46.90 (larger descending trend line hurdle)
On the other hand, a repeated failure to take out trend line hurdle would open doors for a revisit to a recent low of $43.55.

免责声明
这些信息和出版物并非旨在提供,也不构成TradingView提供或认可的任何形式的财务、投资、交易或其他类型的建议或推荐。请阅读使用条款了解更多信息。
免责声明
这些信息和出版物并非旨在提供,也不构成TradingView提供或认可的任何形式的财务、投资、交易或其他类型的建议或推荐。请阅读使用条款了解更多信息。