
Hi there,
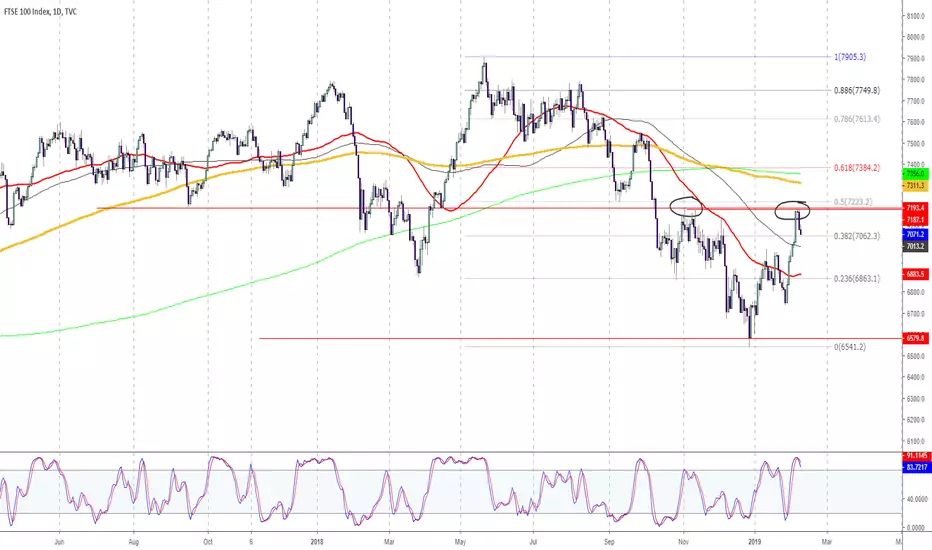
The way i see things (purely my opinion only), technically it makes sense to me why there has been a rejection late last week of the recent rise up.
You may be asking - what is in the way for resistance levels? Well,
We have
- September low (red horizontal line)
- November high (red horizontal line)
- 50% Fib from recent low/high in the way
It is quite possible we may see some weakness next week - based on my daily chart review.
Notes:
Green line = 500 day SMA
Black line = 100 day SMA
Yellow Line = 200 day SMA
Red Line = 55 day SMA
I only use one indicator being the slow stochastic indicator.
No dramas.
bazzman78t
09/02/2019
The way i see things (purely my opinion only), technically it makes sense to me why there has been a rejection late last week of the recent rise up.
You may be asking - what is in the way for resistance levels? Well,
We have
- September low (red horizontal line)
- November high (red horizontal line)
- 50% Fib from recent low/high in the way
It is quite possible we may see some weakness next week - based on my daily chart review.
Notes:
Green line = 500 day SMA
Black line = 100 day SMA
Yellow Line = 200 day SMA
Red Line = 55 day SMA
I only use one indicator being the slow stochastic indicator.
No dramas.
bazzman78t
09/02/2019

bazzman78tv
Updated December 2021
Updated December 2021
免责声明
这些信息和出版物并非旨在提供,也不构成TradingView提供或认可的任何形式的财务、投资、交易或其他类型的建议或推荐。请阅读使用条款了解更多信息。
bazzman78tv
Updated December 2021
Updated December 2021
免责声明
这些信息和出版物并非旨在提供,也不构成TradingView提供或认可的任何形式的财务、投资、交易或其他类型的建议或推荐。请阅读使用条款了解更多信息。