
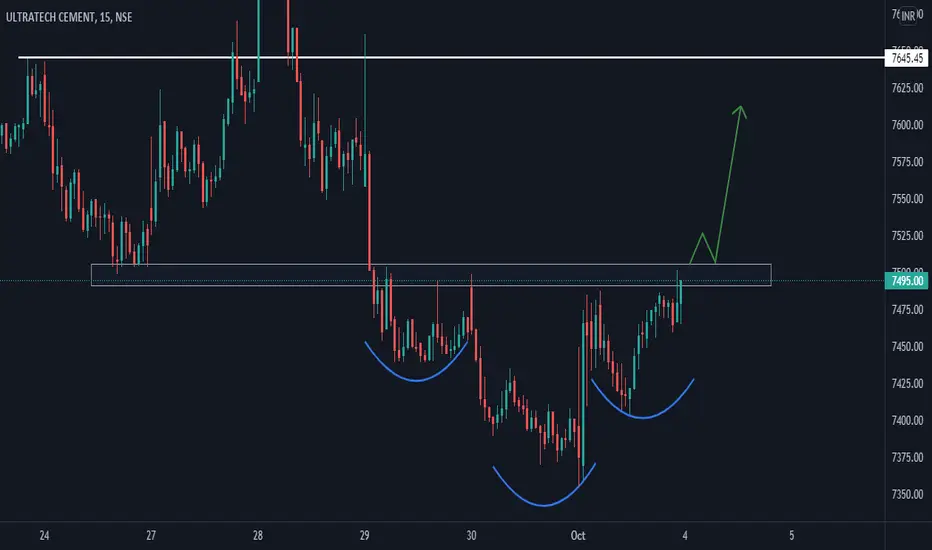
EXPLANATION: This is a 15 min time frame chart of ULTRACEMCO . The stock has been in a downtrend for days and has formed an Inverted head and shoulders pattern. If stock give a strong breakout and broke its supply zone with volumes and has retested the same. I am bullish on ULTRACEMCO .
If you like this analysis give a Like // Follow for more updates , let me know in comments below :)
If you like this analysis give a Like // Follow for more updates , let me know in comments below :)

免责声明
这些信息和出版物并非旨在提供,也不构成TradingView提供或认可的任何形式的财务、投资、交易或其他类型的建议或推荐。请阅读使用条款了解更多信息。
免责声明
这些信息和出版物并非旨在提供,也不构成TradingView提供或认可的任何形式的财务、投资、交易或其他类型的建议或推荐。请阅读使用条款了解更多信息。