
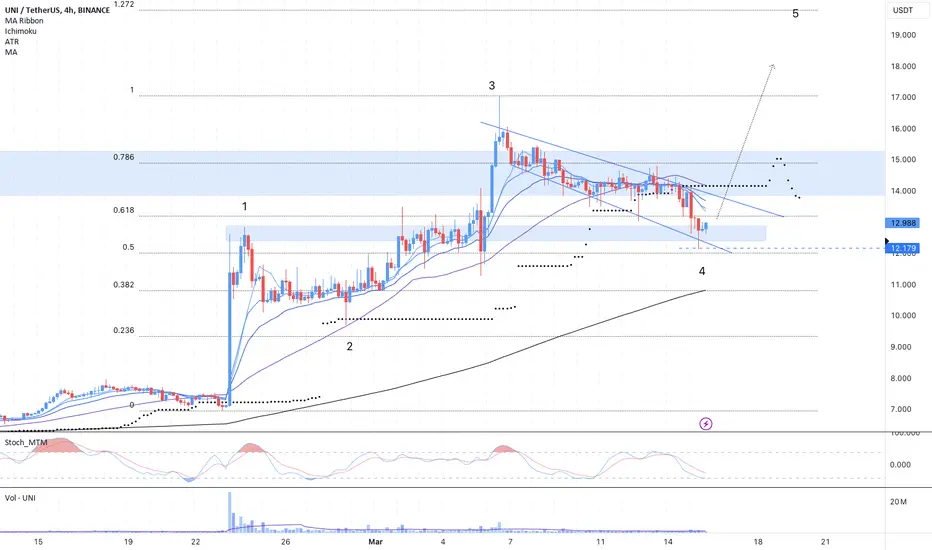
As you can see in the chart above, Uniswap has found support in a previously significant price range, around $12.70. In addition to that, the 4h chart appears to be making a bull flag pattern in this pullback, and the price has also pulled back into a significant fibonacci area, between the .5 and the .618. These indications could mean that wave 5 is coming soon. In the short term, I will be looking for a break above the top trendline on this chart to be fully bullish, and a break below the $12 level as a bearish sign. My price target if it ends up running would be the $20 range, or the fib 1.272. Good luck!

免责声明
这些信息和出版物并非旨在提供,也不构成TradingView提供或认可的任何形式的财务、投资、交易或其他类型的建议或推荐。请阅读使用条款了解更多信息。
免责声明
这些信息和出版物并非旨在提供,也不构成TradingView提供或认可的任何形式的财务、投资、交易或其他类型的建议或推荐。请阅读使用条款了解更多信息。