
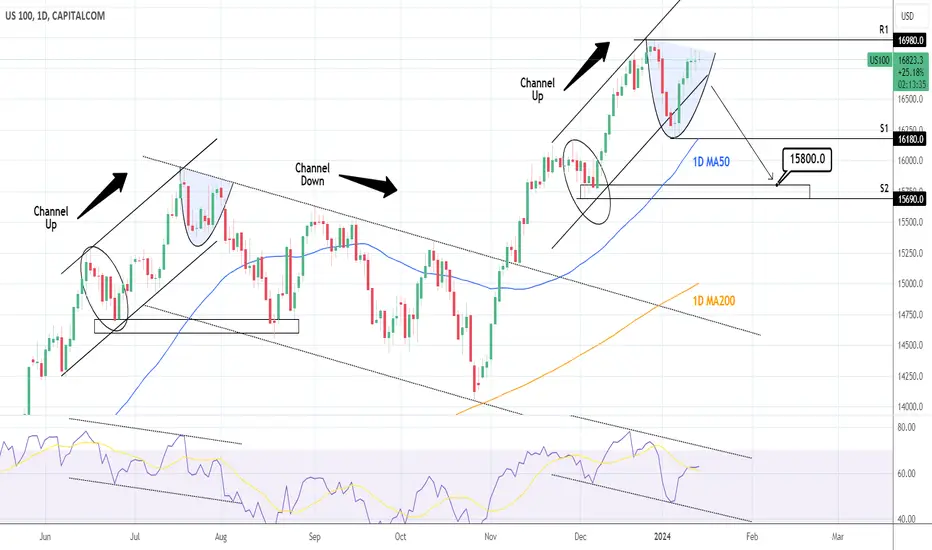
Nasdaq is on a bullish 1D technical outlook (RSI = 60.007, MACD = 103.260, ADX = 29.522) as since January 5th it reversed before testing the 1D MA50 and is near the R1 level (16,980). The last three 1D candles have been flat and with the RSI trading downwards (Bearish Divergence), it is a first sign of a potential technical decline. This is like the top pattern of July 18th 2023, also on an RSI Bearish Divergence. In accordance to that price action, we expect yet another decline under the 1D MA50, for a close test of the 1D MA200. Our target is at the top of the S2 Zone (TP = 15,800).
See how our prior idea has worked out:
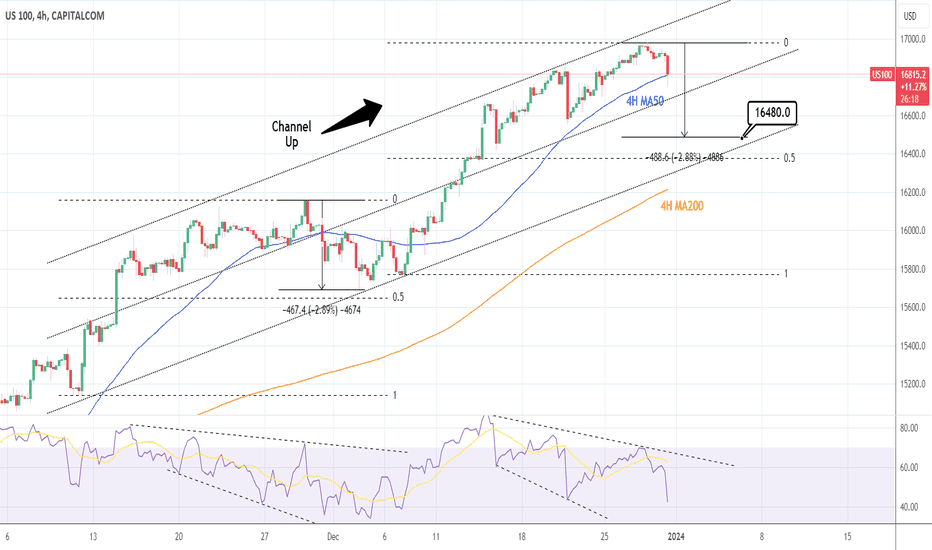
## If you like our free content follow our profile to get more daily ideas. ##
## Comments and likes are greatly appreciated. ##
See how our prior idea has worked out:
## If you like our free content follow our profile to get more daily ideas. ##
## Comments and likes are greatly appreciated. ##

I trade Crypto, Forex, Indices & Commodities all from one account on PrimeXBT with TradingView charts
Register here👉 investingscope.s.gy/PrimeXBT
Contact me for Account Management (+15% monthly profit)
Telegram👉 t.me/investingscope
Register here👉 investingscope.s.gy/PrimeXBT
Contact me for Account Management (+15% monthly profit)
Telegram👉 t.me/investingscope
免责声明
这些信息和出版物并非旨在提供,也不构成TradingView提供或认可的任何形式的财务、投资、交易或其他类型的建议或推荐。请阅读使用条款了解更多信息。
I trade Crypto, Forex, Indices & Commodities all from one account on PrimeXBT with TradingView charts
Register here👉 investingscope.s.gy/PrimeXBT
Contact me for Account Management (+15% monthly profit)
Telegram👉 t.me/investingscope
Register here👉 investingscope.s.gy/PrimeXBT
Contact me for Account Management (+15% monthly profit)
Telegram👉 t.me/investingscope
免责声明
这些信息和出版物并非旨在提供,也不构成TradingView提供或认可的任何形式的财务、投资、交易或其他类型的建议或推荐。请阅读使用条款了解更多信息。