
Macro Compression:
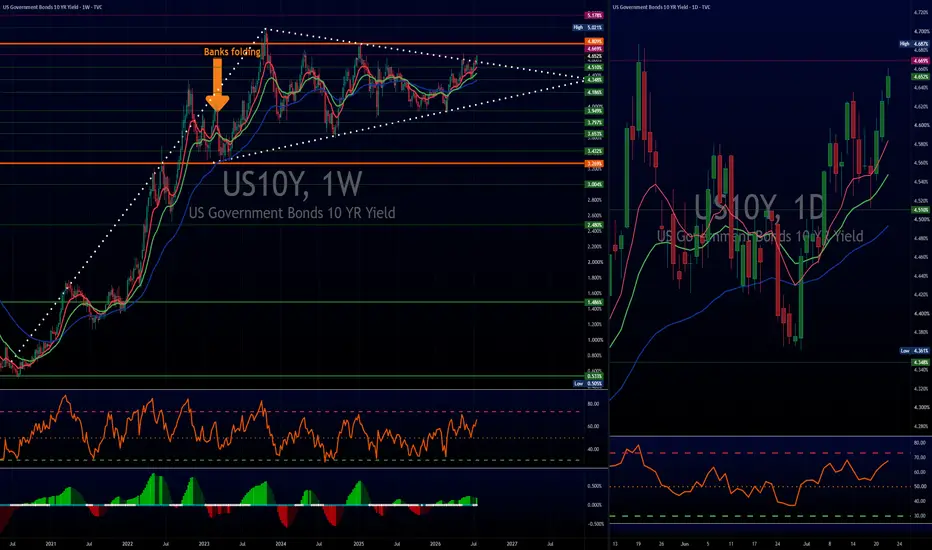
The 10 year yield is nearing the apex of a massive multi year symmetrical triangle/pennant pattern.
Yields are reaching a major inflection point:
Both 10Y and 2Y rates are testing multi month, multi year, structural resistance levels simultaneously.
A clean breakout here would tighten financial conditions rapidly across risk assets.
10 Year Yield: Pure Structural Strength
The 10 Year’s RSI, moving average alignment, and momentum oscillators are all expanding in sync across both daily and weekly timeframes.
Because the 10 Year is leading with much stronger technical health than the 2 Year, the upward push in yields isn't just about Fed rate expectations. It is being driven by term premium expansion and Treasury issuance supply absorption.
Summary:
Unless something changes within this week.. We could be looking at FAR HIGHER rates.
NOT SHOWN:
2 Year Yield: Slower Velocity, but Firm Trend
The 2 Year is heavily tied to Fed policy expectations. The slowing momentum suggests traders aren't pricing in aggressive new rate hikes right NOW, but the resilient RSI proves they aren't pricing in aggressive cuts either. It’s grinding higher on "higher for longer" inertia.
The 10 year yield is nearing the apex of a massive multi year symmetrical triangle/pennant pattern.
Yields are reaching a major inflection point:
Both 10Y and 2Y rates are testing multi month, multi year, structural resistance levels simultaneously.
A clean breakout here would tighten financial conditions rapidly across risk assets.
10 Year Yield: Pure Structural Strength
The 10 Year’s RSI, moving average alignment, and momentum oscillators are all expanding in sync across both daily and weekly timeframes.
Because the 10 Year is leading with much stronger technical health than the 2 Year, the upward push in yields isn't just about Fed rate expectations. It is being driven by term premium expansion and Treasury issuance supply absorption.
Summary:
Unless something changes within this week.. We could be looking at FAR HIGHER rates.
NOT SHOWN:
2 Year Yield: Slower Velocity, but Firm Trend
The 2 Year is heavily tied to Fed policy expectations. The slowing momentum suggests traders aren't pricing in aggressive new rate hikes right NOW, but the resilient RSI proves they aren't pricing in aggressive cuts either. It’s grinding higher on "higher for longer" inertia.

免责声明
这些信息和出版物并非旨在提供,也不构成TradingView提供或认可的任何形式的财务、投资、交易或其他类型的建议或推荐。请阅读使用条款了解更多信息。