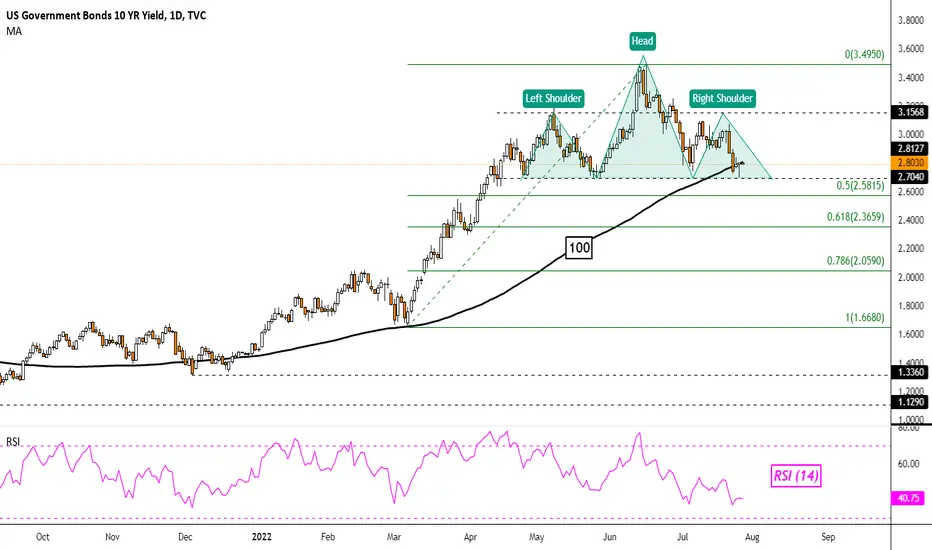
The 10-Year Treasury yield has been consolidating since April as traders grappled with inflation and recession woes.
Now, a bearish Head & Shoulders chart formation is prevailing. At the time of publishing, prices finished forming the right shoulder and were trading at the neckline, which seems to be around 2.70.
This is as the 100-day Simple Moving Average is holding up as support. It could still maintain the dominant uptrend.
Otherwise, confirming a breakout under the neckline and the moving average may open the door to a broader reversal.
Key levels to watch to the downside include the 61.8% and 78.6% Fibonacci retracements at 2.36 and 2.05 respectively. Beyond the latter sits the March low at 1.66.
Overturning the Head & Shoulders entails a push above the right shoulder, which is just below 3.15.
 US10Y
US10Y
Now, a bearish Head & Shoulders chart formation is prevailing. At the time of publishing, prices finished forming the right shoulder and were trading at the neckline, which seems to be around 2.70.
This is as the 100-day Simple Moving Average is holding up as support. It could still maintain the dominant uptrend.
Otherwise, confirming a breakout under the neckline and the moving average may open the door to a broader reversal.
Key levels to watch to the downside include the 61.8% and 78.6% Fibonacci retracements at 2.36 and 2.05 respectively. Beyond the latter sits the March low at 1.66.
Overturning the Head & Shoulders entails a push above the right shoulder, which is just below 3.15.
US10Y
免责声明
这些信息和出版物并非旨在提供,也不构成TradingView提供或认可的任何形式的财务、投资、交易或其他类型的建议或推荐。请阅读使用条款了解更多信息。