
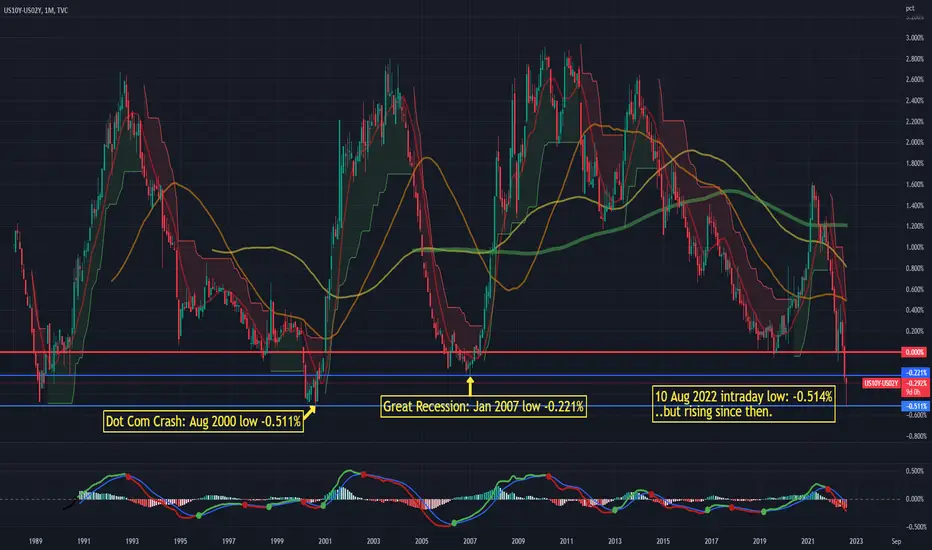
US10Y treasury yield minus US02Y treasury yield is an accurate predictor of impending economic recession. Here we compare the 10 Aug 2022 yield curve inversion low point to the low points in 2007 and 2000 that pre-dated the Great Recession and Dot Com stock market crashes. While a small inversion (below 0) does not always pre-date a recession, inversions as low as the current 10 Aug 2022 always have.
Even more interesting is when you zoom in to the daily chart. Here we see the 10Y - 2Y moving back towards 0 from 10 Aug 2022 through 22 Aug 2022, even as stocks have begun to decline since release of the Fed minutes and recent commentary from Fed officials about the importance of continuing with additional rate hikes based on current inflation data.
Even more interesting is when you zoom in to the daily chart. Here we see the 10Y - 2Y moving back towards 0 from 10 Aug 2022 through 22 Aug 2022, even as stocks have begun to decline since release of the Fed minutes and recent commentary from Fed officials about the importance of continuing with additional rate hikes based on current inflation data.

免责声明
这些信息和出版物并非旨在提供,也不构成TradingView提供或认可的任何形式的财务、投资、交易或其他类型的建议或推荐。请阅读使用条款了解更多信息。
免责声明
这些信息和出版物并非旨在提供,也不构成TradingView提供或认可的任何形式的财务、投资、交易或其他类型的建议或推荐。请阅读使用条款了解更多信息。