
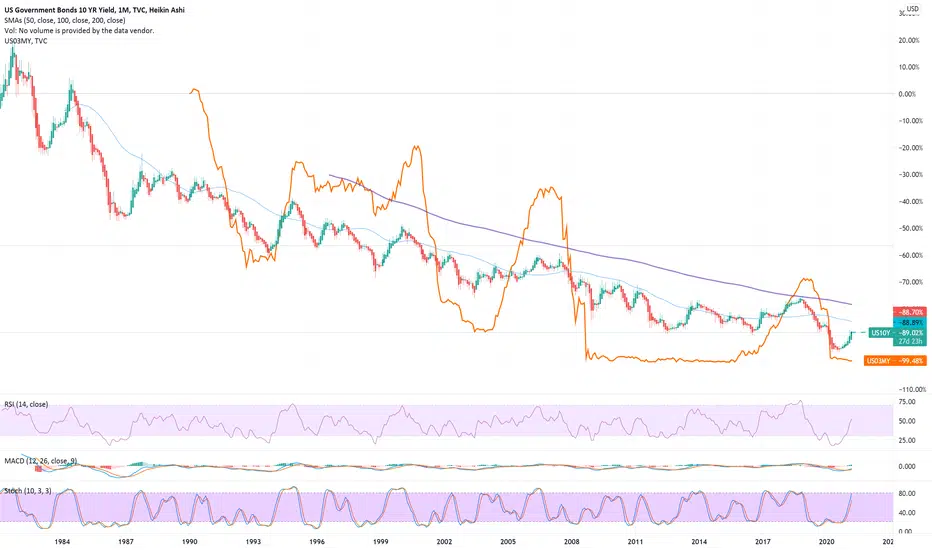
Not my idea, but it does seem to hold some water. Note the orange spikes above the 10 Yr T Bill and pull up history 1990/2000/2008 serious corrections
6-18 months after the 3 Mo/10yr treasury rates invert, the US economy goes into recession
1991 was a 33% drop, 2001 - 83%, 2008 - 54%
I've seen longer data sets that hold true even farther back from FRED
*NOT FINANCIAL ADVICE - NOT A FINANCIAL ADVISOR*
6-18 months after the 3 Mo/10yr treasury rates invert, the US economy goes into recession
1991 was a 33% drop, 2001 - 83%, 2008 - 54%
I've seen longer data sets that hold true even farther back from FRED
*NOT FINANCIAL ADVICE - NOT A FINANCIAL ADVISOR*
注释
Using the SPX500 above in Yellow, 3 historic times the 3Mo was > 10YrAverage SPX drop 40%
注释

免责声明
这些信息和出版物并非旨在提供,也不构成TradingView提供或认可的任何形式的财务、投资、交易或其他类型的建议或推荐。请阅读使用条款了解更多信息。