
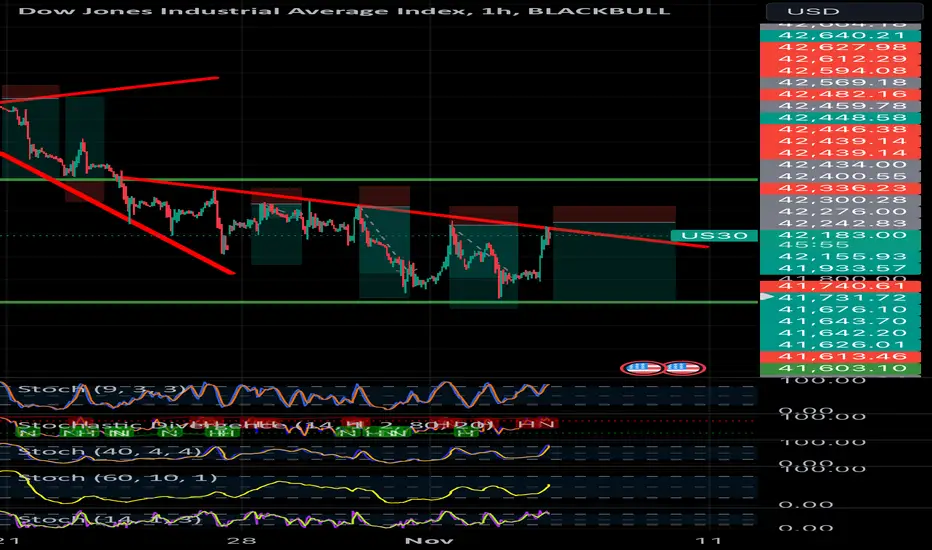
US30 Sell Technical Analysis
The US30 Dow Jones Industrial Average is currently showing a downtrend on the 1-hour chart, as evidenced by the descending trendline and multiple failed attempts to break above resistance. The Stochastic indicators also suggest overbought conditions, with the potential for a downward movement as momentum appears to be weakening. Additionally, previous rejections at the resistance zone highlight seller dominance in this range. A break below the support levels could accelerate selling pressure, making it a favorable setup for a short position.
The US30 Dow Jones Industrial Average is currently showing a downtrend on the 1-hour chart, as evidenced by the descending trendline and multiple failed attempts to break above resistance. The Stochastic indicators also suggest overbought conditions, with the potential for a downward movement as momentum appears to be weakening. Additionally, previous rejections at the resistance zone highlight seller dominance in this range. A break below the support levels could accelerate selling pressure, making it a favorable setup for a short position.

免责声明
这些信息和出版物并非旨在提供,也不构成TradingView提供或认可的任何形式的财务、投资、交易或其他类型的建议或推荐。请阅读使用条款了解更多信息。
免责声明
这些信息和出版物并非旨在提供,也不构成TradingView提供或认可的任何形式的财务、投资、交易或其他类型的建议或推荐。请阅读使用条款了解更多信息。