Technical Analysis Overview:
1. Daily Chart:
• Price has retraced sharply into resistance (near 41,300–41,400), rejecting the 200-day EMA zone.
• MACD still negative but turning up—suggests potential for a failed bounce.
• RSI at 55.33—approaching overbought in a corrective move, ripe for reversal.
2. 15-Min Chart:
• Bearish divergence forming on RSI with lower highs.
• MACD is turning down with momentum fading after a recent high around 41,665.
• Price has broken short-term moving average support, with momentum shifting down.
3. 3-Min Chart:
• Clear bearish structure with lower highs and lower lows.
• MACD and RSI confirm short-term weakness.
• Price hovering near local support (around 41,302), if broken, would confirm further downside.
⸻
Fundamental Context (Macro):
• FOMC & NFP results (recent) suggest continued uncertainty in interest rate direction.
• US manufacturing and employment data have shown mixed signals—equities vulnerable to downside corrections amid macro volatility.
• Seasonally, May is often a pullback month (“Sell in May”).
⸻
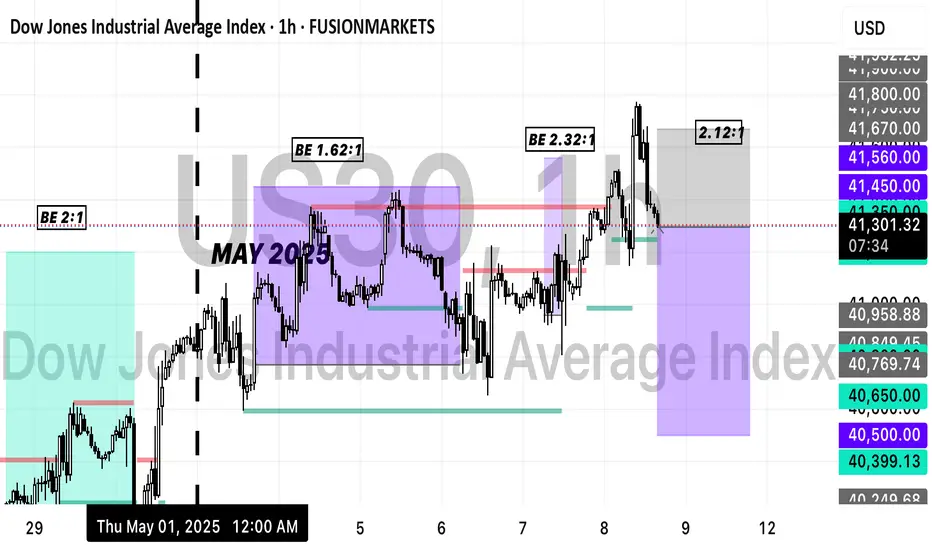
TRADE IDEA – SHORT US30
• Entry: 41,295 (current price at resistance zone)
• Stop-Loss (SL): 41,670 (above recent intraday high and 15-min resistance)
• Take-Profit (TP): 40,500 (prior support zone on 15-min chart)
 US30
US30
1. Daily Chart:
• Price has retraced sharply into resistance (near 41,300–41,400), rejecting the 200-day EMA zone.
• MACD still negative but turning up—suggests potential for a failed bounce.
• RSI at 55.33—approaching overbought in a corrective move, ripe for reversal.
2. 15-Min Chart:
• Bearish divergence forming on RSI with lower highs.
• MACD is turning down with momentum fading after a recent high around 41,665.
• Price has broken short-term moving average support, with momentum shifting down.
3. 3-Min Chart:
• Clear bearish structure with lower highs and lower lows.
• MACD and RSI confirm short-term weakness.
• Price hovering near local support (around 41,302), if broken, would confirm further downside.
⸻
Fundamental Context (Macro):
• FOMC & NFP results (recent) suggest continued uncertainty in interest rate direction.
• US manufacturing and employment data have shown mixed signals—equities vulnerable to downside corrections amid macro volatility.
• Seasonally, May is often a pullback month (“Sell in May”).
⸻
TRADE IDEA – SHORT US30
• Entry: 41,295 (current price at resistance zone)
• Stop-Loss (SL): 41,670 (above recent intraday high and 15-min resistance)
• Take-Profit (TP): 40,500 (prior support zone on 15-min chart)
US30 交易结束:到达止损
MARKET GAPPED UP OVER WEEKEND, SL TRIGGERED
免责声明
这些信息和出版物并非旨在提供,也不构成TradingView提供或认可的任何形式的财务、投资、交易或其他类型的建议或推荐。请阅读使用条款了解更多信息。
免责声明
这些信息和出版物并非旨在提供,也不构成TradingView提供或认可的任何形式的财务、投资、交易或其他类型的建议或推荐。请阅读使用条款了解更多信息。