How we will develop long setups on US500
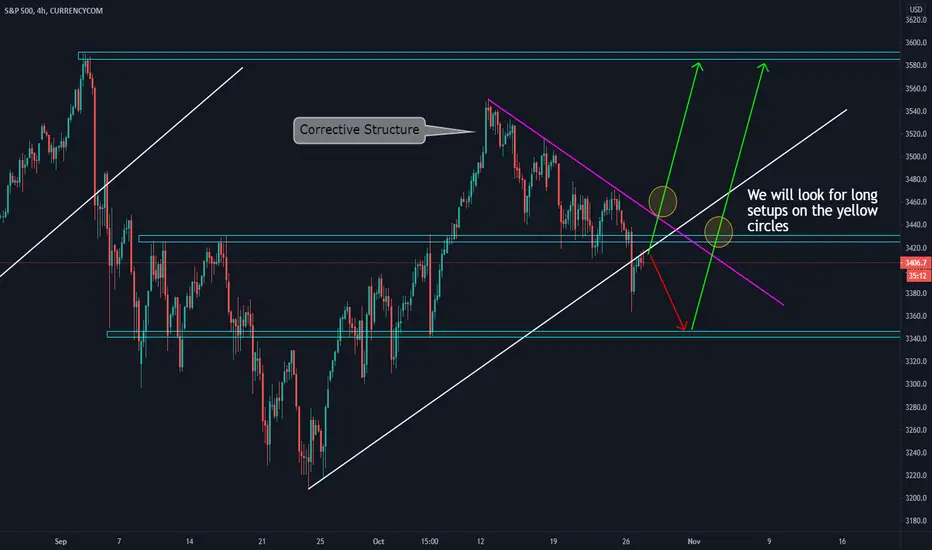
Today, we will show you our trading plan for US500
A) The price is inside a corrective structure (purple line). From a technical perspective, this can be considered a continuation pattern (flag pattern)
B) A key level to develop long setups is the breakout of the purple trendline. That would provide us evidence that the bullish movement is about to start
C) However, we will not trade the breakout directly. We will wait for a minor correction on the 30 minutes chart on the yellow circle
D) We have two possible paths for the bullish movement expressed on the two green arrows
E) Never forget that this is a trading plan for a bullish scenario. If the situation we are expecting does not happen, we will keep our money on the sideline.

免责声明
这些信息和出版物并非旨在提供,也不构成TradingView提供或认可的任何形式的财务、投资、交易或其他类型的建议或推荐。请阅读使用条款了解更多信息。
免责声明
这些信息和出版物并非旨在提供,也不构成TradingView提供或认可的任何形式的财务、投资、交易或其他类型的建议或推荐。请阅读使用条款了解更多信息。