
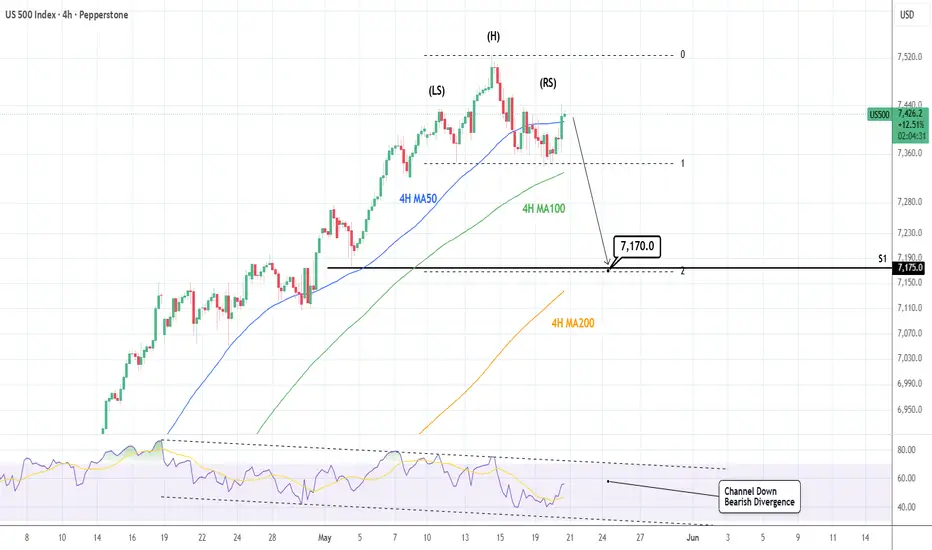
The S&P500 remains almost overbought on the 1W technical outlook (RSI = 68.727, MACD = 178.950, ADX = 36.338) as it is still near the Highs of the recent April-May rally. This is the first time that is shows legitimate signs of a Top and reversal on the medium term. The pattern that has emerged is a H&S that formed is support on the 4H MA100 and has just completed the RS. Technically we should be seeing an immediate decline to the 2.0 Fibonacci extension (TP = 7,170), exactly on the May 4th Low (S1) aimed at testing the 4H MA200. Note that the 4H RSI has been on a Channel Down for over a month, a strong Bearish Divergence that has led to this market top.
## If you like our free content follow our profile to get more daily ideas. ##
## Comments and likes are greatly appreciated. ##
## If you like our free content follow our profile to get more daily ideas. ##
## Comments and likes are greatly appreciated. ##

I trade Crypto, Forex, Indices & Commodities all from one account on PrimeXBT with TradingView charts
Register here👉 investingscope.s.gy/PrimeXBT
Contact me for Account Management (+15% monthly profit)
Telegram👉 t.me/investingscope
Register here👉 investingscope.s.gy/PrimeXBT
Contact me for Account Management (+15% monthly profit)
Telegram👉 t.me/investingscope
免责声明
这些信息和出版物并非旨在提供,也不构成TradingView提供或认可的任何形式的财务、投资、交易或其他类型的建议或推荐。请阅读使用条款了解更多信息。
I trade Crypto, Forex, Indices & Commodities all from one account on PrimeXBT with TradingView charts
Register here👉 investingscope.s.gy/PrimeXBT
Contact me for Account Management (+15% monthly profit)
Telegram👉 t.me/investingscope
Register here👉 investingscope.s.gy/PrimeXBT
Contact me for Account Management (+15% monthly profit)
Telegram👉 t.me/investingscope
免责声明
这些信息和出版物并非旨在提供,也不构成TradingView提供或认可的任何形式的财务、投资、交易或其他类型的建议或推荐。请阅读使用条款了解更多信息。