
# S&P 500 (US500) Technical Analysis: Advanced Multi-Timeframe Trading Strategy & Weekly Forecast
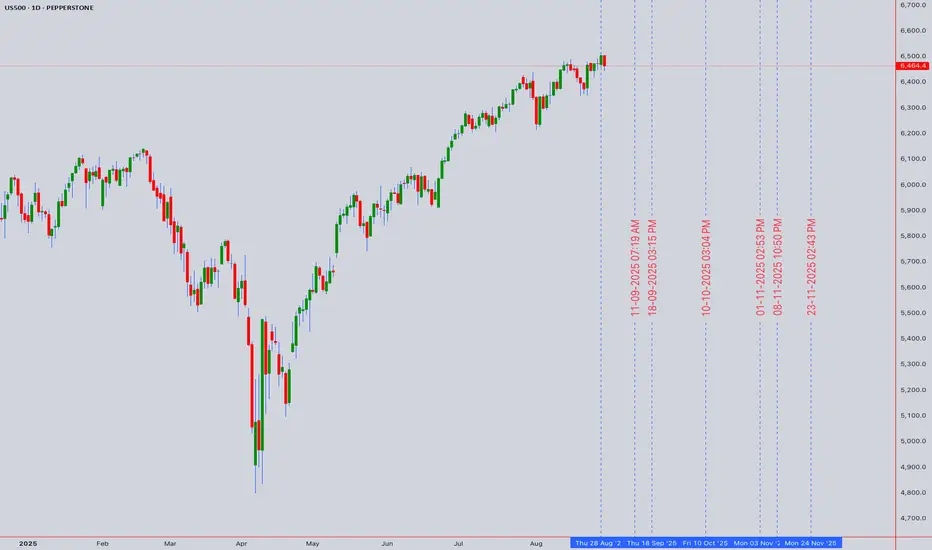
Current Price: 6,464.4 (As of August 30, 2025, 12:54 AM UTC+4)
Asset Class: US500 / S&P 500 Index
Analysis Date: August 30, 2025
---
Executive Summary
The S&P 500 continues to demonstrate strong bullish momentum, currently trading near all-time highs at 6,464.4. Our comprehensive technical analysis utilizing Japanese Candlestick patterns, Harmonic analysis, Elliott Wave Theory, Wyckoff methodology, W.D. Gann principles, and Ichimoku Kinko Hyo indicates a cautiously optimistic outlook with key resistance levels approaching. The index has successfully achieved conservative targets around 6,474-6,504 level, with the next major target zone near 7,000.
---
Multi-Timeframe Technical Analysis
Elliott Wave Analysis
The S&P 500 appears to be in the final stages of a major impulse wave (Wave 5) within a larger degree cycle. The wave structure suggests:
Primary Count: Currently in Wave 5 of (5) of [5]
Target Zone: 6,800-7,000 for wave completion
Invalidation Level: Break below 6,147 (July low)
Wyckoff Market Structure
The current phase aligns with Wyckoff's Distribution Phase characteristics:
Phase: Late Markup Phase transitioning to potential Distribution
Volume Analysis: Decreasing volume on recent highs suggests weakening demand
Price Action: Narrowing trading ranges indicating potential climax conditions
W.D. Gann Analysis
Applying Gann's comprehensive methodology:
Square of 9 Analysis:
- Current price 6,464.4 sits at a significant Gann square level
- Next major resistance: 6,724 (45-degree angle projection)
- Time cycles suggest potential reversal window: September 15-20, 2025
Angle Analysis:
- 1x1 angle support from July low: 6,200-6,250
- 2x1 angle resistance: 6,700-6,750
Price & Time Harmonics:
- 90-day cycle completion due mid-September
- Price squares suggest natural resistance at 6,561 and 6,724
---
Japanese Candlestick & Harmonic Patterns
Recent Candlestick Formations (Daily Chart)
Spinning Top: August 28-29 showing indecision at highs
Long Upper Shadows: Indicating selling pressure at resistance levels
Volume Confirmation: Bearish divergence with declining volume
Harmonic Pattern Recognition
Potential Bat Pattern: Completion zone 6,480-6,520
ABCD Pattern: Active completion at current levels
Fibonacci Confluence: 1.618 extension target at 6,756
---
Ichimoku Kinko Hyo Analysis
Current Cloud Structure
Price Position: Above Kumo (bullish)
Tenkan-sen: 6,431 (short-term trend)
Kijun-sen: 6,378 (medium-term trend)
Senkou Span A: 6,405
Senkou Span B: 6,341
Chikou Span: Positioned above price action (confirming bullish sentiment)
Future Kumo: Thinning cloud ahead suggests potential volatility increase
---
Key Technical Indicators Analysis
RSI (Relative Strength Index)
Daily RSI: 68.7 (approaching overbought territory)
Weekly RSI: 71.2 (overbought but not extreme)
4H RSI: 72.1 (overbought with bearish divergence forming)
Bollinger Bands Analysis
Position: Price trading at upper band
Bandwidth: Contracting, suggesting low volatility environment
Squeeze: Potential breakout setup forming
VWAP (Volume Weighted Average Price)
Daily VWAP: 6,442
Weekly VWAP: 6,398
Volume Profile: Low volume acceptance above 6,450
Moving Average Structure
20 EMA: 6,419 (immediate support)
50 SMA: 6,371 (key support level)
200 SMA: 6,198 (major trend support)
Golden Cross: 50/200 cross remains intact (bullish)
---
Support & Resistance Levels
Primary Resistance Levels
1. R1: 6,480 (immediate resistance - Harmonic completion)
2. R2: 6,520 (psychological level)
3. R3: 6,561 (Gann square resistance)
4. R4: 6,724 (Major Gann angle resistance)
5. R5: 6,800-7,000 (Elliott Wave target zone)
Primary Support Levels
1. S1: 6,431 (Tenkan-sen support)
2. S2: 6,378 (Kijun-sen support)
3. S3: 6,300-6,150 (Monthly pullback zone)
4. S4: 6,200-6,250 (1x1 Gann angle)
5. S5: 6,147 (July low - critical support)
---
Multi-Timeframe Strategy Framework
Scalping Strategy (5M & 15M Charts)
5-Minute Timeframe:
Entry Signals: Look for pullbacks to 20 EMA with RSI oversold (<30)
Profit Targets: 15-25 points per trade
Stop Loss: 10-15 points below entry
Volume Confirmation: Above average volume on breakouts
15-Minute Timeframe:
Range Trading: 6,440-6,480 current range
Breakout Strategy: Volume spike above 6,480 for continuation
Mean Reversion: Fade moves beyond 2 standard deviations from VWAP
Intraday Strategy (30M, 1H, 4H Charts)
30-Minute Strategy:
Trend Following: Long above 20/50 EMA confluence
Target: 6,520 initial, 6,561 extended
Risk Management: 2:1 reward-to-risk minimum
1-Hour Strategy:
Pattern Recognition: Monitor for bull flag formations
Volume Analysis: Require volume expansion on breakouts
Time-Based Exits: Avoid holding through 3:30 PM ET volatility
4-Hour Strategy:
Swing Setup: Long on pullbacks to Ichimoku cloud support
Momentum Confirmation: Wait for RSI to reset below 50
Position Sizing: Adjust for overnight gap risk
Swing Trading Strategy (Daily, Weekly, Monthly)
Daily Chart Strategy:
Trend Continuation: Long on breaks above 6,480 with volume
Pullback Entries: 6,378-6,300 zone for swing longs
Profit Targets: 6,724 (primary), 6,800-7,000 (extended)
Weekly Chart Strategy:
Long-Term Trend: Remains intact above 6,200
Position Management: Scale out at resistance levels
Risk Assessment: Monitor weekly RSI for extreme readings
---
Daily Trading Plan: September 2-6, 2025
Monday, September 2, 2025 (Labor Day - Markets Closed)
Pre-Market Preparation:
- Monitor overnight futures for gap scenarios
- Review weekend news for market-moving events
- Prepare watchlists for Tuesday's session
Tuesday, September 3, 2025
Market Outlook: Post-holiday session with potential low volume
Key Levels:
Resistance: 6,480, 6,520
Support: 6,431, 6,378
Strategy:
Morning: Range-bound trading likely; fade extremes
Afternoon: Watch for institutional flows post-holiday
Entry Zones: Long 6,430-6,440 area, Short above 6,480
Wednesday, September 4, 2025
Market Outlook: Mid-week momentum session
Key Events: Monitor for any Federal Reserve communications
Strategy:
Breakout Play: Above 6,480 targets 6,520-6,561
Volume Confirmation: Required for sustained moves
Risk Management: Tight stops in low-volume environment
Thursday, September 5, 2025
Market Outlook: Potential volatility increase ahead of Friday
Key Levels:
Critical Resistance: 6,520-6,561 zone
Support: 6,400-6,378 (buy zone)
Strategy:
Trend Following: Momentum plays above key resistance
Counter-Trend: Fade moves on declining volume
Friday, September 6, 2025
Market Outlook: Weekly close positioning and potential NFP impact
Strategy:
Early Session: Position for weekly close
Late Session: Prepare for weekend risk management
Options Expiry: Monitor for pinning effects at key strikes
---
Geopolitical & Macroeconomic Considerations
Federal Reserve Policy Impact
President Donald Trump has called on the Fed to cut rates by 3 percentage points, with Treasury Secretary Scott Bessent noting that "any model" would put the benchmark federal funds rate at least 1.5 percentage points lower than its current level of between 4.25 percent and 4.50 percent. This political pressure on the Fed could create market volatility as investors weigh the likelihood of aggressive rate cuts.
Key Risks to Monitor
1. Federal Reserve Policy Divergence: Potential conflicts between Fed independence and political pressure
2. Geopolitical Tensions: Geopolitical fragmentation is being fueled by COVID-19, the war in Ukraine, U.S.-China relations and more
3. Economic Data: Any significant deviation from expected economic indicators
4. Market Structure: Elevated valuations increase sensitivity to negative catalysts
Earnings Season Considerations
- Q3 earnings season approaching in mid-October
- Current valuations require strong earnings growth for justification
- Sector rotation potential based on earnings guidance
---
Risk Management Framework
Position Sizing Guidelines
Scalping: 0.5-1% risk per trade
Intraday: 1-2% risk per trade
Swing Trading: 2-3% risk per position
Maximum Portfolio Risk: 6-8% total exposure
Stop-Loss Protocols
Scalping: 10-15 points maximum
Intraday: 25-40 points based on volatility
Swing: Below key support levels (6,300 for current longs)
Profit-Taking Strategy
Scale Out Approach: Take 50% at first target, 25% at second target
Trailing Stops: Implement once position moves 2:1 favorable
Time-Based Exits: Close positions before major news events
---
Weekly Outlook Summary
Bullish Scenarios (Probability: 60%)
- Break above 6,480 with volume expansion
- Federal Reserve maintains dovish stance
- Strong technical momentum continues
Targets: 6,520, 6,561, 6,724
Bearish Scenarios (Probability: 40%)
- Failure at resistance with volume decline
- Geopolitical shock or Fed hawkish surprise
- Technical breakdown below 6,378
Targets: 6,300, 6,200, 6,147
Base Case Expectation:
Continued range-bound trading with upward bias, eventual breakout to 6,520-6,561 zone before more significant pullback to test 6,300-6,200 support area.
---
For individuals seeking to enhance their trading abilities based on the analyses provided, I recommend exploring the mentoring program offered by Shunya Trade. (Website: shunya dot trade)
I would appreciate your feedback on this analysis, as it will serve as a valuable resource for future endeavors.
Sincerely,
Shunya.Trade
Website: shunya dot trade
Disclaimer: This post is intended solely for educational purposes and does not constitute investment advice, financial advice, or trading recommendations. The views expressed herein are derived from technical analysis and are shared for informational purposes only. The stock market inherently carries risks, including the potential for capital loss. Therefore, readers are strongly advised to exercise prudent judgment before making any investment decisions. We assume no liability for any actions taken based on this content. For personalized guidance, it is recommended to consult a certified financial advisor.
Current Price: 6,464.4 (As of August 30, 2025, 12:54 AM UTC+4)
Asset Class: US500 / S&P 500 Index
Analysis Date: August 30, 2025
---
Executive Summary
The S&P 500 continues to demonstrate strong bullish momentum, currently trading near all-time highs at 6,464.4. Our comprehensive technical analysis utilizing Japanese Candlestick patterns, Harmonic analysis, Elliott Wave Theory, Wyckoff methodology, W.D. Gann principles, and Ichimoku Kinko Hyo indicates a cautiously optimistic outlook with key resistance levels approaching. The index has successfully achieved conservative targets around 6,474-6,504 level, with the next major target zone near 7,000.
---
Multi-Timeframe Technical Analysis
Elliott Wave Analysis
The S&P 500 appears to be in the final stages of a major impulse wave (Wave 5) within a larger degree cycle. The wave structure suggests:
Primary Count: Currently in Wave 5 of (5) of [5]
Target Zone: 6,800-7,000 for wave completion
Invalidation Level: Break below 6,147 (July low)
Wyckoff Market Structure
The current phase aligns with Wyckoff's Distribution Phase characteristics:
Phase: Late Markup Phase transitioning to potential Distribution
Volume Analysis: Decreasing volume on recent highs suggests weakening demand
Price Action: Narrowing trading ranges indicating potential climax conditions
W.D. Gann Analysis
Applying Gann's comprehensive methodology:
Square of 9 Analysis:
- Current price 6,464.4 sits at a significant Gann square level
- Next major resistance: 6,724 (45-degree angle projection)
- Time cycles suggest potential reversal window: September 15-20, 2025
Angle Analysis:
- 1x1 angle support from July low: 6,200-6,250
- 2x1 angle resistance: 6,700-6,750
Price & Time Harmonics:
- 90-day cycle completion due mid-September
- Price squares suggest natural resistance at 6,561 and 6,724
---
Japanese Candlestick & Harmonic Patterns
Recent Candlestick Formations (Daily Chart)
Spinning Top: August 28-29 showing indecision at highs
Long Upper Shadows: Indicating selling pressure at resistance levels
Volume Confirmation: Bearish divergence with declining volume
Harmonic Pattern Recognition
Potential Bat Pattern: Completion zone 6,480-6,520
ABCD Pattern: Active completion at current levels
Fibonacci Confluence: 1.618 extension target at 6,756
---
Ichimoku Kinko Hyo Analysis
Current Cloud Structure
Price Position: Above Kumo (bullish)
Tenkan-sen: 6,431 (short-term trend)
Kijun-sen: 6,378 (medium-term trend)
Senkou Span A: 6,405
Senkou Span B: 6,341
Chikou Span: Positioned above price action (confirming bullish sentiment)
Future Kumo: Thinning cloud ahead suggests potential volatility increase
---
Key Technical Indicators Analysis
RSI (Relative Strength Index)
Daily RSI: 68.7 (approaching overbought territory)
Weekly RSI: 71.2 (overbought but not extreme)
4H RSI: 72.1 (overbought with bearish divergence forming)
Bollinger Bands Analysis
Position: Price trading at upper band
Bandwidth: Contracting, suggesting low volatility environment
Squeeze: Potential breakout setup forming
VWAP (Volume Weighted Average Price)
Daily VWAP: 6,442
Weekly VWAP: 6,398
Volume Profile: Low volume acceptance above 6,450
Moving Average Structure
20 EMA: 6,419 (immediate support)
50 SMA: 6,371 (key support level)
200 SMA: 6,198 (major trend support)
Golden Cross: 50/200 cross remains intact (bullish)
---
Support & Resistance Levels
Primary Resistance Levels
1. R1: 6,480 (immediate resistance - Harmonic completion)
2. R2: 6,520 (psychological level)
3. R3: 6,561 (Gann square resistance)
4. R4: 6,724 (Major Gann angle resistance)
5. R5: 6,800-7,000 (Elliott Wave target zone)
Primary Support Levels
1. S1: 6,431 (Tenkan-sen support)
2. S2: 6,378 (Kijun-sen support)
3. S3: 6,300-6,150 (Monthly pullback zone)
4. S4: 6,200-6,250 (1x1 Gann angle)
5. S5: 6,147 (July low - critical support)
---
Multi-Timeframe Strategy Framework
Scalping Strategy (5M & 15M Charts)
5-Minute Timeframe:
Entry Signals: Look for pullbacks to 20 EMA with RSI oversold (<30)
Profit Targets: 15-25 points per trade
Stop Loss: 10-15 points below entry
Volume Confirmation: Above average volume on breakouts
15-Minute Timeframe:
Range Trading: 6,440-6,480 current range
Breakout Strategy: Volume spike above 6,480 for continuation
Mean Reversion: Fade moves beyond 2 standard deviations from VWAP
Intraday Strategy (30M, 1H, 4H Charts)
30-Minute Strategy:
Trend Following: Long above 20/50 EMA confluence
Target: 6,520 initial, 6,561 extended
Risk Management: 2:1 reward-to-risk minimum
1-Hour Strategy:
Pattern Recognition: Monitor for bull flag formations
Volume Analysis: Require volume expansion on breakouts
Time-Based Exits: Avoid holding through 3:30 PM ET volatility
4-Hour Strategy:
Swing Setup: Long on pullbacks to Ichimoku cloud support
Momentum Confirmation: Wait for RSI to reset below 50
Position Sizing: Adjust for overnight gap risk
Swing Trading Strategy (Daily, Weekly, Monthly)
Daily Chart Strategy:
Trend Continuation: Long on breaks above 6,480 with volume
Pullback Entries: 6,378-6,300 zone for swing longs
Profit Targets: 6,724 (primary), 6,800-7,000 (extended)
Weekly Chart Strategy:
Long-Term Trend: Remains intact above 6,200
Position Management: Scale out at resistance levels
Risk Assessment: Monitor weekly RSI for extreme readings
---
Daily Trading Plan: September 2-6, 2025
Monday, September 2, 2025 (Labor Day - Markets Closed)
Pre-Market Preparation:
- Monitor overnight futures for gap scenarios
- Review weekend news for market-moving events
- Prepare watchlists for Tuesday's session
Tuesday, September 3, 2025
Market Outlook: Post-holiday session with potential low volume
Key Levels:
Resistance: 6,480, 6,520
Support: 6,431, 6,378
Strategy:
Morning: Range-bound trading likely; fade extremes
Afternoon: Watch for institutional flows post-holiday
Entry Zones: Long 6,430-6,440 area, Short above 6,480
Wednesday, September 4, 2025
Market Outlook: Mid-week momentum session
Key Events: Monitor for any Federal Reserve communications
Strategy:
Breakout Play: Above 6,480 targets 6,520-6,561
Volume Confirmation: Required for sustained moves
Risk Management: Tight stops in low-volume environment
Thursday, September 5, 2025
Market Outlook: Potential volatility increase ahead of Friday
Key Levels:
Critical Resistance: 6,520-6,561 zone
Support: 6,400-6,378 (buy zone)
Strategy:
Trend Following: Momentum plays above key resistance
Counter-Trend: Fade moves on declining volume
Friday, September 6, 2025
Market Outlook: Weekly close positioning and potential NFP impact
Strategy:
Early Session: Position for weekly close
Late Session: Prepare for weekend risk management
Options Expiry: Monitor for pinning effects at key strikes
---
Geopolitical & Macroeconomic Considerations
Federal Reserve Policy Impact
President Donald Trump has called on the Fed to cut rates by 3 percentage points, with Treasury Secretary Scott Bessent noting that "any model" would put the benchmark federal funds rate at least 1.5 percentage points lower than its current level of between 4.25 percent and 4.50 percent. This political pressure on the Fed could create market volatility as investors weigh the likelihood of aggressive rate cuts.
Key Risks to Monitor
1. Federal Reserve Policy Divergence: Potential conflicts between Fed independence and political pressure
2. Geopolitical Tensions: Geopolitical fragmentation is being fueled by COVID-19, the war in Ukraine, U.S.-China relations and more
3. Economic Data: Any significant deviation from expected economic indicators
4. Market Structure: Elevated valuations increase sensitivity to negative catalysts
Earnings Season Considerations
- Q3 earnings season approaching in mid-October
- Current valuations require strong earnings growth for justification
- Sector rotation potential based on earnings guidance
---
Risk Management Framework
Position Sizing Guidelines
Scalping: 0.5-1% risk per trade
Intraday: 1-2% risk per trade
Swing Trading: 2-3% risk per position
Maximum Portfolio Risk: 6-8% total exposure
Stop-Loss Protocols
Scalping: 10-15 points maximum
Intraday: 25-40 points based on volatility
Swing: Below key support levels (6,300 for current longs)
Profit-Taking Strategy
Scale Out Approach: Take 50% at first target, 25% at second target
Trailing Stops: Implement once position moves 2:1 favorable
Time-Based Exits: Close positions before major news events
---
Weekly Outlook Summary
Bullish Scenarios (Probability: 60%)
- Break above 6,480 with volume expansion
- Federal Reserve maintains dovish stance
- Strong technical momentum continues
Targets: 6,520, 6,561, 6,724
Bearish Scenarios (Probability: 40%)
- Failure at resistance with volume decline
- Geopolitical shock or Fed hawkish surprise
- Technical breakdown below 6,378
Targets: 6,300, 6,200, 6,147
Base Case Expectation:
Continued range-bound trading with upward bias, eventual breakout to 6,520-6,561 zone before more significant pullback to test 6,300-6,200 support area.
---
For individuals seeking to enhance their trading abilities based on the analyses provided, I recommend exploring the mentoring program offered by Shunya Trade. (Website: shunya dot trade)
I would appreciate your feedback on this analysis, as it will serve as a valuable resource for future endeavors.
Sincerely,
Shunya.Trade
Website: shunya dot trade
Disclaimer: This post is intended solely for educational purposes and does not constitute investment advice, financial advice, or trading recommendations. The views expressed herein are derived from technical analysis and are shared for informational purposes only. The stock market inherently carries risks, including the potential for capital loss. Therefore, readers are strongly advised to exercise prudent judgment before making any investment decisions. We assume no liability for any actions taken based on this content. For personalized guidance, it is recommended to consult a certified financial advisor.

I am nothing @shunya.trade
免责声明
这些信息和出版物并非旨在提供,也不构成TradingView提供或认可的任何形式的财务、投资、交易或其他类型的建议或推荐。请阅读使用条款了解更多信息。
I am nothing @shunya.trade
免责声明
这些信息和出版物并非旨在提供,也不构成TradingView提供或认可的任何形式的财务、投资、交易或其他类型的建议或推荐。请阅读使用条款了解更多信息。