

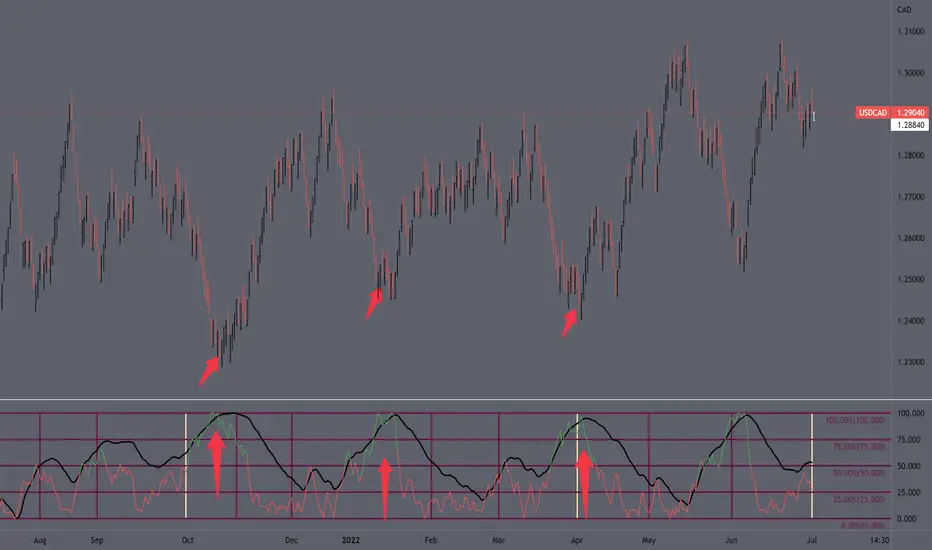
This was an interesting find using the EMA on Implied vol indicator. Looking at the technicals below the bar chart price has rallied 3 out of 3 times when this has happened during oct 2021 and April 2022. Along with the rallies have come the sell offs unlike the rallies the black EMA and the vix fix line track each other as the market sells off causing the red line to turn green and signal the next market rallies. I have still have to do back testing with it being this accurate it my be repainting.
Heres a link to my chart tradingview.com/chart/eGcjASRE/
Heres a link to my chart tradingview.com/chart/eGcjASRE/

免责声明
这些信息和出版物并非旨在提供,也不构成TradingView提供或认可的任何形式的财务、投资、交易或其他类型的建议或推荐。请阅读使用条款了解更多信息。
免责声明
这些信息和出版物并非旨在提供,也不构成TradingView提供或认可的任何形式的财务、投资、交易或其他类型的建议或推荐。请阅读使用条款了解更多信息。