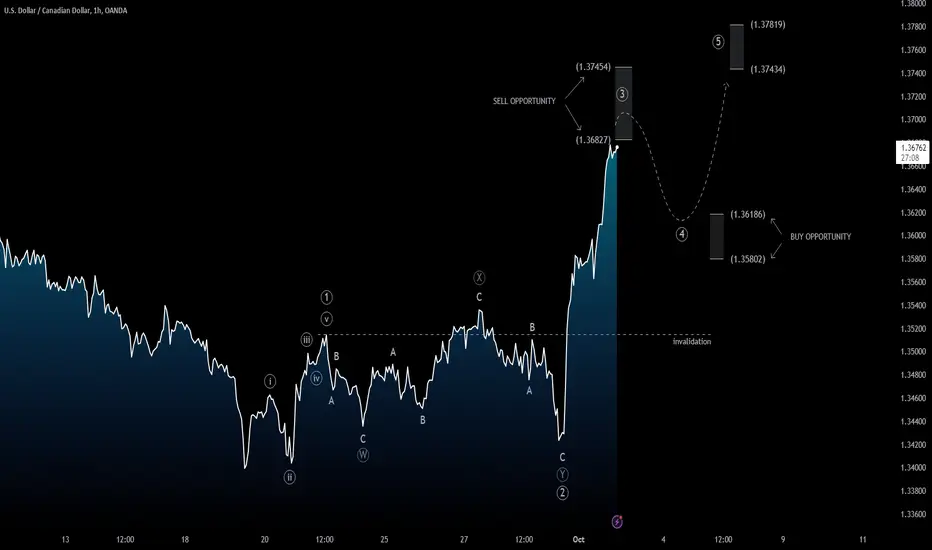
Technically the 
 USDCAD pair seems to follow 12345 bullish impulse structure on intraday chart. Having said this, it is possible to follow 2 setups (bearish and bullish) on levels shown on the chart. On the short side, it is good to monitor and manage the position closely and move stop loss to breakeven as soon as possible. In this case the expected pullback could take the form of ABC or ABCDE Pattern. Levels may change, so follow our updates below or on our website.
Trade with care
Like | Share | Comment
USDCAD pair seems to follow 12345 bullish impulse structure on intraday chart. Having said this, it is possible to follow 2 setups (bearish and bullish) on levels shown on the chart. On the short side, it is good to monitor and manage the position closely and move stop loss to breakeven as soon as possible. In this case the expected pullback could take the form of ABC or ABCDE Pattern. Levels may change, so follow our updates below or on our website.Trade with care
Like | Share | Comment
交易开始
🔴 Sell Area注释
📊 Resistance Area Approach:注释

免责声明
这些信息和出版物并非旨在提供,也不构成TradingView提供或认可的任何形式的财务、投资、交易或其他类型的建议或推荐。请阅读使用条款了解更多信息。
免责声明
这些信息和出版物并非旨在提供,也不构成TradingView提供或认可的任何形式的财务、投资、交易或其他类型的建议或推荐。请阅读使用条款了解更多信息。