

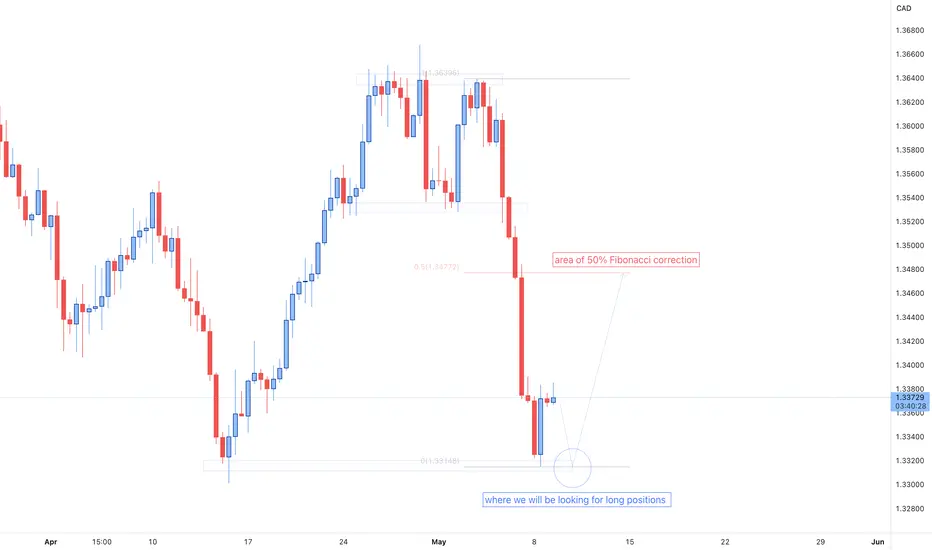
As it can be inferred from the H8-timeframe graph, the price has made a successful initial bounce off the 1.331 - 1.332 area of support that is highlighted on the graph.
Observing the ongoing price development, is can be noticed that the price is failing to push higher, and that it might perform another re-touch of the same zone (1.331 - 1.332) and form another bottom (a Double Bottom formation) before commencing its bullish moves.
Hence, we are having close eyes on the region circled on the graphic (1.33 - 1.332) and awaiting the price to reach that specific level before continuing the upside run.
Our initial target will be set at the area of 50% Fibonacci retracement level drawn from the top to the bottom of the recent bearish impulse.
Observing the ongoing price development, is can be noticed that the price is failing to push higher, and that it might perform another re-touch of the same zone (1.331 - 1.332) and form another bottom (a Double Bottom formation) before commencing its bullish moves.
Hence, we are having close eyes on the region circled on the graphic (1.33 - 1.332) and awaiting the price to reach that specific level before continuing the upside run.
Our initial target will be set at the area of 50% Fibonacci retracement level drawn from the top to the bottom of the recent bearish impulse.

免责声明
这些信息和出版物并非旨在提供,也不构成TradingView提供或认可的任何形式的财务、投资、交易或其他类型的建议或推荐。请阅读使用条款了解更多信息。