

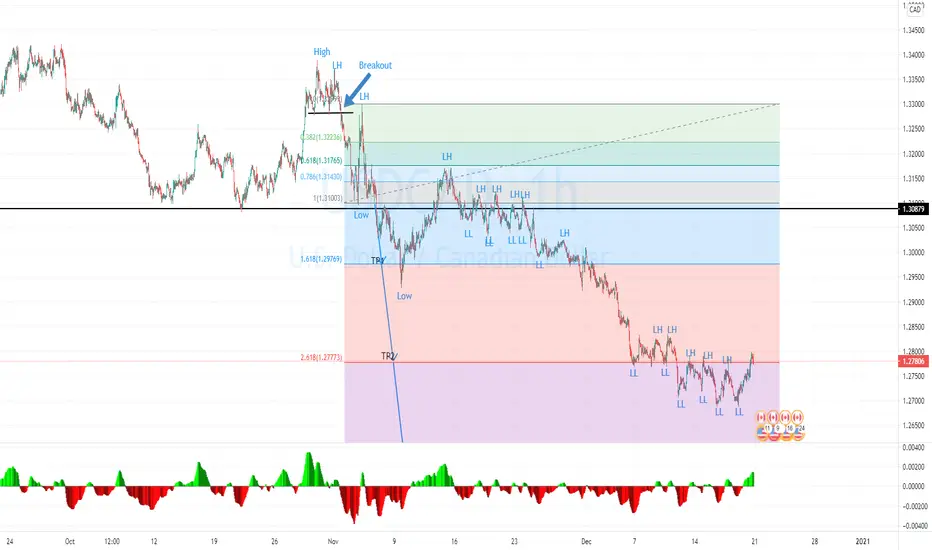
USDCAD on the 1H time-frame.
Steps:
1. The price still running downtrend by created the lower high and lower low.
2. The price already hit TP1: 1.29769 and TP2: 1.27773 at the Fibonacci level.
3. The next level is TP3: 1.25431 and 1.24546 at the support zone in Day time frame.
4. If the next MACD (-) create the higher low then there will be the 1st step of the reversal pattern.
Steps:
1. The price still running downtrend by created the lower high and lower low.
2. The price already hit TP1: 1.29769 and TP2: 1.27773 at the Fibonacci level.
3. The next level is TP3: 1.25431 and 1.24546 at the support zone in Day time frame.
4. If the next MACD (-) create the higher low then there will be the 1st step of the reversal pattern.

免责声明
这些信息和出版物并非旨在提供,也不构成TradingView提供或认可的任何形式的财务、投资、交易或其他类型的建议或推荐。请阅读使用条款了解更多信息。
免责声明
这些信息和出版物并非旨在提供,也不构成TradingView提供或认可的任何形式的财务、投资、交易或其他类型的建议或推荐。请阅读使用条款了解更多信息。