

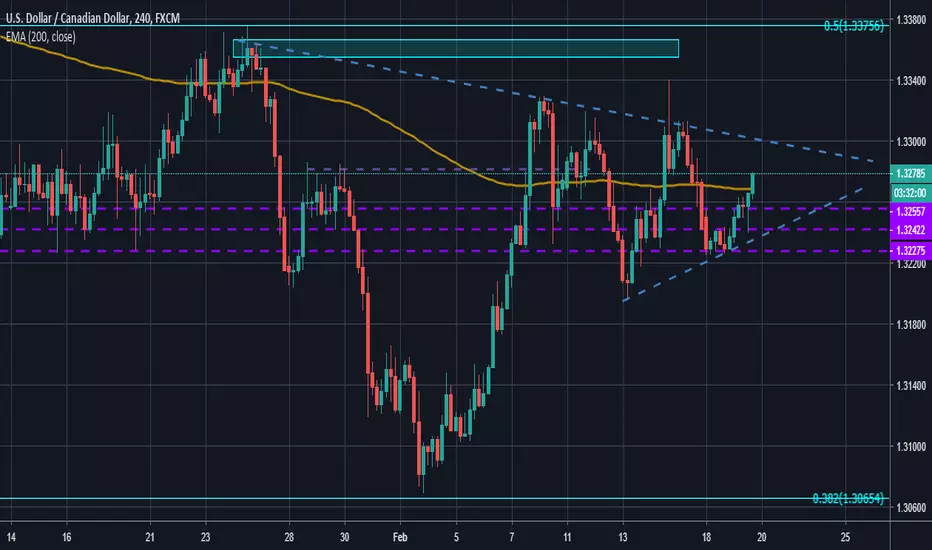
Price broke through the 200 day EMA and is moving towards the higher part of the wedge pattern we see forming. The way price is forming around the corner of the triangle reminds a bit of an inverse head and shoulders pattern.
For a bullish trade one should wait for a breakout of this pattern. In this case, the bullish movement would need to be strong and an entry around 1.3300 would be appropriate. You can also wait, see how strong the breakout is, and enter after the breakout and retest of the pattern. If price drops below 1.3200 or the 200EMA this trade would need to be closed as that could lead to a bearish decline. Especially if oil continues to climb.
For a bullish trade one should wait for a breakout of this pattern. In this case, the bullish movement would need to be strong and an entry around 1.3300 would be appropriate. You can also wait, see how strong the breakout is, and enter after the breakout and retest of the pattern. If price drops below 1.3200 or the 200EMA this trade would need to be closed as that could lead to a bearish decline. Especially if oil continues to climb.

免责声明
这些信息和出版物并非旨在提供,也不构成TradingView提供或认可的任何形式的财务、投资、交易或其他类型的建议或推荐。请阅读使用条款了解更多信息。
免责声明
这些信息和出版物并非旨在提供,也不构成TradingView提供或认可的任何形式的财务、投资、交易或其他类型的建议或推荐。请阅读使用条款了解更多信息。