

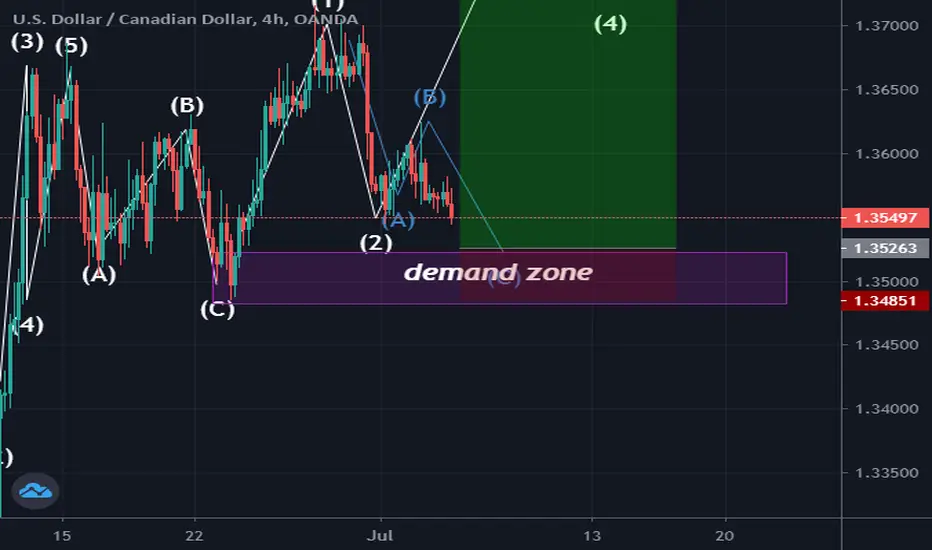
The USDCAD chart below is analyzed using both elliott wave and Demand and supply zone(the two most powerful technical analysis tools).The wave 2 of wave 3 extension is a potential zigzag in formation which on completion will end in the Demand zone(potential zone where buyers will come into the market massively) hence, a bullish rally is expected to end at the 1.618(no extension) or 2.618 (extension) fibonacci level as those are levels where wave 3 tends to end.The risk to reward ratio is compelling.......more pips guys....Kingofthemarket says hi

免责声明
这些信息和出版物并非旨在提供,也不构成TradingView提供或认可的任何形式的财务、投资、交易或其他类型的建议或推荐。请阅读使用条款了解更多信息。
免责声明
这些信息和出版物并非旨在提供,也不构成TradingView提供或认可的任何形式的财务、投资、交易或其他类型的建议或推荐。请阅读使用条款了解更多信息。