

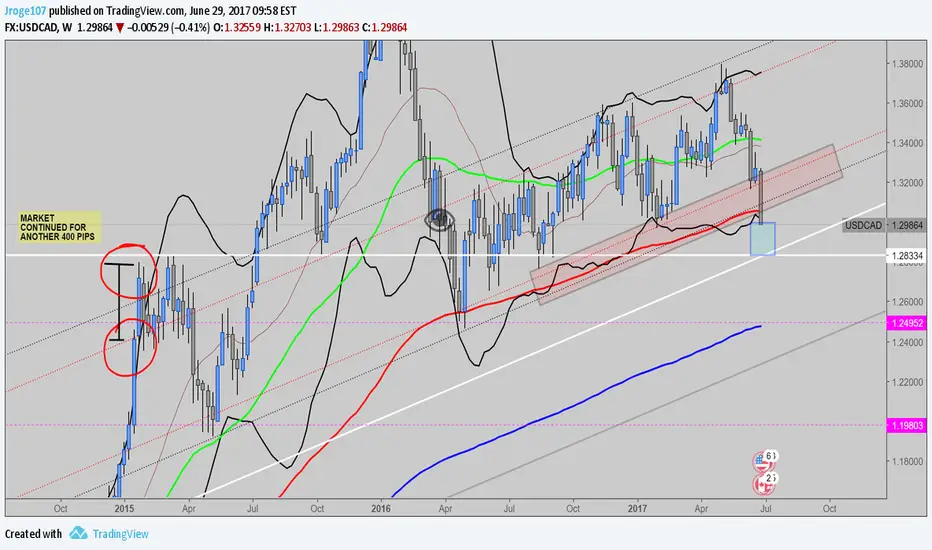
If usdcad weekly candle closes below bollinger bands, i am looking at price to continue down around the 1.275-1.283 range. My "alligator" indicator is showing a full open mouth, with potential of more downside. If you look back on the chart, the last few times the candles close outside of the bollinger bands the market usually continues for a minimum of another 100-200 pips.
This small continuation puts us right around the white support/resistance line. Look for a good sign of a reversal at this time, if a pinbar forms i will be looking at opportunities to enter long into UC.
This small continuation puts us right around the white support/resistance line. Look for a good sign of a reversal at this time, if a pinbar forms i will be looking at opportunities to enter long into UC.

免责声明
这些信息和出版物并非旨在提供,也不构成TradingView提供或认可的任何形式的财务、投资、交易或其他类型的建议或推荐。请阅读使用条款了解更多信息。