

🚨 USD/CHF Forecast: The Next Move is Almost Here! 🚨
Hey traders, check out this detailed analysis of USD/CHF on the 4-hour, Daily, and Weekly charts. A lot's going on, so let's break it down!
🔍 4-Hour Chart (Top Left):
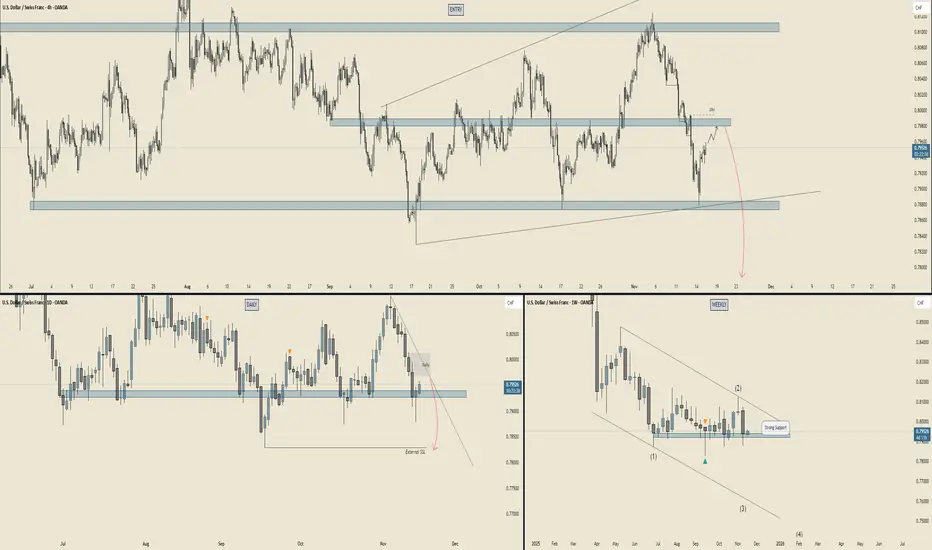
We’re seeing price testing major support and resistance levels (highlighted in blue). The market looks ready to make a move! We’re keeping a close eye on the Entry Zone at the top, where we might see a continuation of the trend. If we see price action confirming this, it’s game time! ⚡
📅 Daily Chart (Middle Left):
Price has been in a downward trend, but notice that crucial support zone forming below. The trend seems like it could be ready for a bounce back. Will the support hold, or are we headed for a deeper pullback? The next few days will be key! 💡
📊 Weekly Chart (Bottom Right):
Big picture time! This looks like the beginning of something exciting. The longer-term trend is in a clear downward channel (marked by those diagonal lines). That strong support at 0.7800 could be our lifeline. If it holds, we might see the pair shoot up in the coming weeks. 📈✨
💥 Key Levels to Watch:
Resistance: 0.8100 (Keep your eyes on this! It’s a major barrier to break).
Support: 0.7800 (This is where things could get interesting).
Next Target: If the support holds, we could see a move higher toward 0.8000, and potentially test the resistance zone again.
🌟 What’s Next?
The battle between the bulls and bears is heating up! Will USD/CHF rebound off this support level, or will it break lower? Stay tuned for confirmation of the move and prepare for action. 📉📈
Hey traders, check out this detailed analysis of USD/CHF on the 4-hour, Daily, and Weekly charts. A lot's going on, so let's break it down!
🔍 4-Hour Chart (Top Left):
We’re seeing price testing major support and resistance levels (highlighted in blue). The market looks ready to make a move! We’re keeping a close eye on the Entry Zone at the top, where we might see a continuation of the trend. If we see price action confirming this, it’s game time! ⚡
📅 Daily Chart (Middle Left):
Price has been in a downward trend, but notice that crucial support zone forming below. The trend seems like it could be ready for a bounce back. Will the support hold, or are we headed for a deeper pullback? The next few days will be key! 💡
📊 Weekly Chart (Bottom Right):
Big picture time! This looks like the beginning of something exciting. The longer-term trend is in a clear downward channel (marked by those diagonal lines). That strong support at 0.7800 could be our lifeline. If it holds, we might see the pair shoot up in the coming weeks. 📈✨
💥 Key Levels to Watch:
Resistance: 0.8100 (Keep your eyes on this! It’s a major barrier to break).
Support: 0.7800 (This is where things could get interesting).
Next Target: If the support holds, we could see a move higher toward 0.8000, and potentially test the resistance zone again.
🌟 What’s Next?
The battle between the bulls and bears is heating up! Will USD/CHF rebound off this support level, or will it break lower? Stay tuned for confirmation of the move and prepare for action. 📉📈

免责声明
这些信息和出版物并非旨在提供,也不构成TradingView提供或认可的任何形式的财务、投资、交易或其他类型的建议或推荐。请阅读使用条款了解更多信息。
免责声明
这些信息和出版物并非旨在提供,也不构成TradingView提供或认可的任何形式的财务、投资、交易或其他类型的建议或推荐。请阅读使用条款了解更多信息。