

+ At monthly candle chart we have 0.764 Fibonacci retracement level. This is good for buy signal.
+ Previous week candle was bullish. This is good for buy signal.
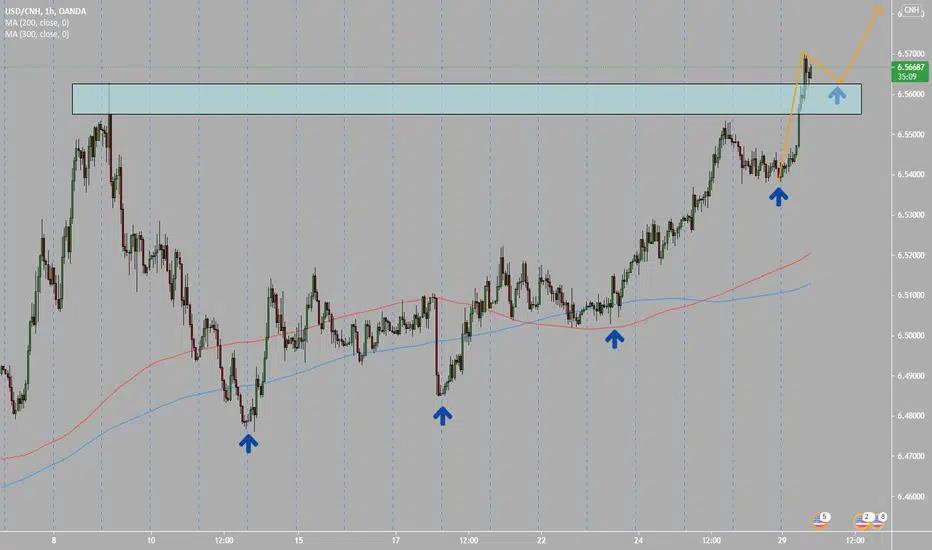
+ At daily candle timeframe market show us bullish signals at 1 hour timeframe.
Idea is wait for one hour candle timeframe closing at the highest point and go with the crowd forward.
+ Previous week candle was bullish. This is good for buy signal.
+ At daily candle timeframe market show us bullish signals at 1 hour timeframe.
Idea is wait for one hour candle timeframe closing at the highest point and go with the crowd forward.

免责声明
这些信息和出版物并非旨在提供,也不构成TradingView提供或认可的任何形式的财务、投资、交易或其他类型的建议或推荐。请阅读使用条款了解更多信息。