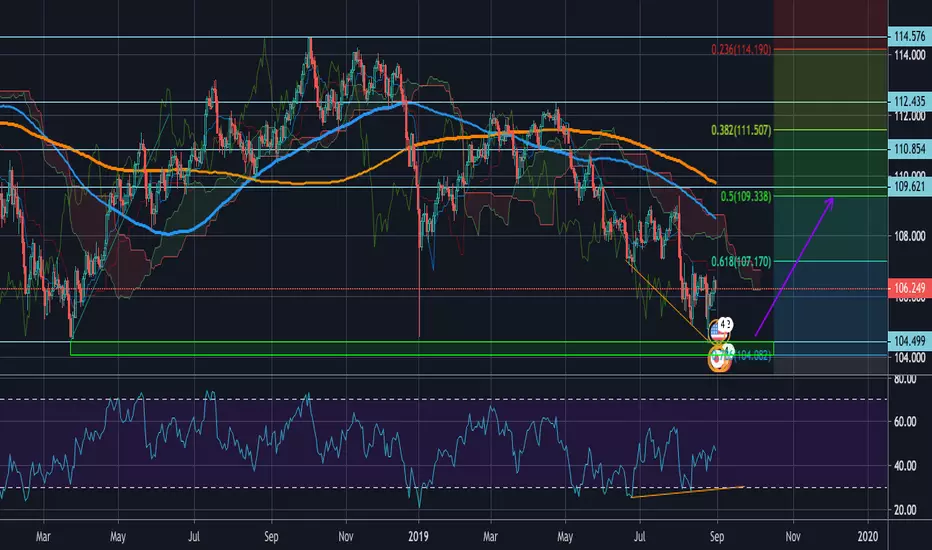
*Yellow = 200 EMA | Blue = 100 EMA
This is the
 USDJPY with Ichimoku overlayed with two moving averages. This pair is setting up nicely for a 500 pip move between 104.499 and 109.621. The support around 104.50 level has been used as resistance multiple times during September and October 2016. It has been used as support March 2018, January 2019, and August 2019. This support also moves in confluence with a 0.786 Fibonacci Retracement Level and resistance moves in confluence with 0.5 Fib Level.
This strong level is also being approached with bullish divergence between RSI(14) and price. The RSI hit the 25 level end of June 2019 and proceeded to fall over 200 pips (106.740 - 104.50 level Approx.) while RSI moved up to over 35.
What to look for?
a) Break of Kijun Sen
The Kijun-Sen is also called the Baseline and acts as a moving average as well as major resistance/support. A break of this moving average would indicate further action supported by the Kijun-Sen and most likely a complementing Tenkan-Sen (Conversion Line) cross.
b) Kumo (Cloud) Twist
The Kumo Twist is the Ichimoku Cloud transitioning from one side to another and in this case, would signal the move from bearish to bullish sentiment and indicate further bullish price action.
c) Kumo Breakout
The Kumo breakout accompanied by the other two factors would be a show of strength off the support and a potential play for the resistance.
Keep an eye out for these factors, and good luck traders!
This is the
USDJPY with Ichimoku overlayed with two moving averages. This pair is setting up nicely for a 500 pip move between 104.499 and 109.621. The support around 104.50 level has been used as resistance multiple times during September and October 2016. It has been used as support March 2018, January 2019, and August 2019. This support also moves in confluence with a 0.786 Fibonacci Retracement Level and resistance moves in confluence with 0.5 Fib Level. This strong level is also being approached with bullish divergence between RSI(14) and price. The RSI hit the 25 level end of June 2019 and proceeded to fall over 200 pips (106.740 - 104.50 level Approx.) while RSI moved up to over 35.
What to look for?
a) Break of Kijun Sen
The Kijun-Sen is also called the Baseline and acts as a moving average as well as major resistance/support. A break of this moving average would indicate further action supported by the Kijun-Sen and most likely a complementing Tenkan-Sen (Conversion Line) cross.
b) Kumo (Cloud) Twist
The Kumo Twist is the Ichimoku Cloud transitioning from one side to another and in this case, would signal the move from bearish to bullish sentiment and indicate further bullish price action.
c) Kumo Breakout
The Kumo breakout accompanied by the other two factors would be a show of strength off the support and a potential play for the resistance.
Keep an eye out for these factors, and good luck traders!

免责声明
这些信息和出版物并非旨在提供,也不构成TradingView提供或认可的任何形式的财务、投资、交易或其他类型的建议或推荐。请阅读使用条款了解更多信息。
免责声明
这些信息和出版物并非旨在提供,也不构成TradingView提供或认可的任何形式的财务、投资、交易或其他类型的建议或推荐。请阅读使用条款了解更多信息。