

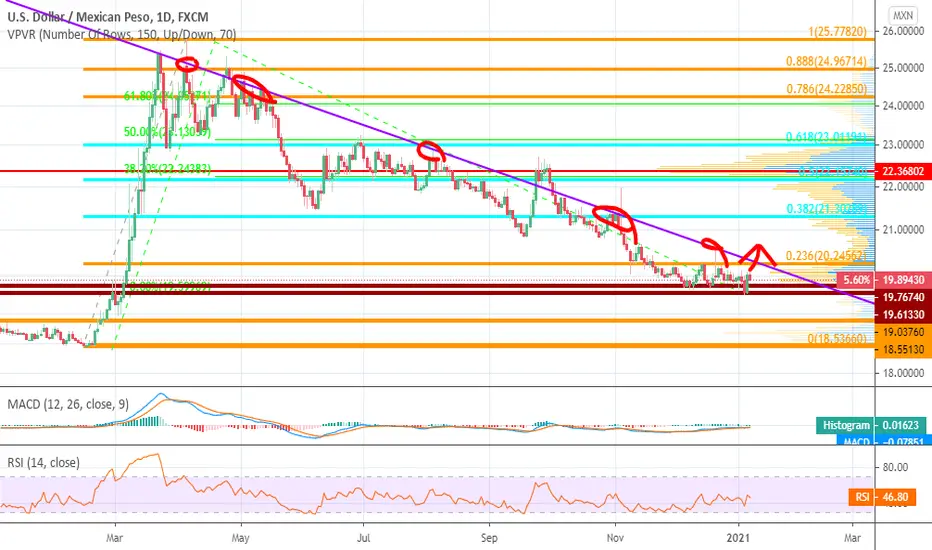
USDMXN has been in a deep move down and now has a what might become a potential bottom. Breaking the trendline (points where it tested are circled in red) would be a good signal...looks like the trendline with the fib line (orange horizontal line) might be the intersect, around 20.25.
By breaking, we would like to see a daily break and ideally a weekly break above.
By breaking, we would like to see a daily break and ideally a weekly break above.

免责声明
这些信息和出版物并非旨在提供,也不构成TradingView提供或认可的任何形式的财务、投资、交易或其他类型的建议或推荐。请阅读使用条款了解更多信息。