

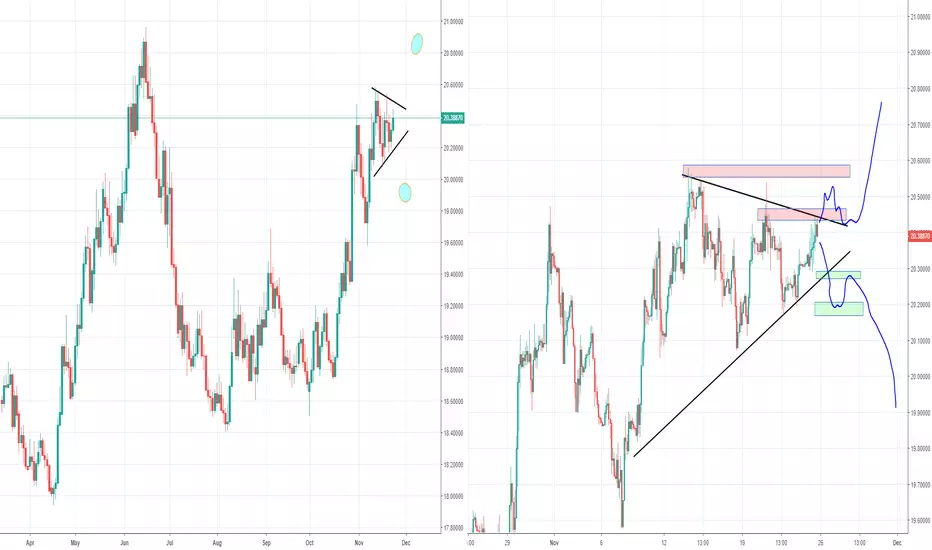
Looks like a solid triangle here and from the looks of it we will probably see a break on the upside. But every triangle can go both ways. So i am going to wait for some confirmation first. So i want to see it move like one of the blue lines first before going in the trade. So a break of the triangle and a retest.
Please don't forget to like if you appreciate this :)
Previous analysis:
Please don't forget to like if you appreciate this :)
Previous analysis:
注释
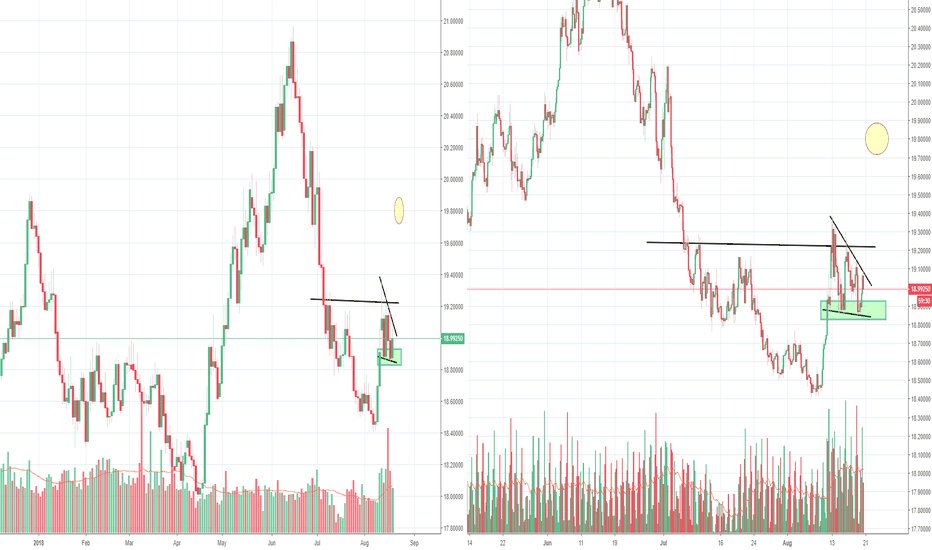
So we broke the resistance and made a quick textbook pullback to test the former resistance zone. Pullbacks don't always happen, but with FX they usually do, if we don't see a big squeeze at the breakout. On the right we can see that we might even have done that bigger pullback already (yellow zone). With FX pullbacks are not always textbook to bounce up from the former resistance zone. So i am going to keep my stop around that green support on the bottom right chart, just below the entry. If we start to move up i will slowly move my stop up as well注释
Before i forget, i have drawn a big bearish wedge on the left, which is my next game plan. Will depend on how things go the coming days注释
Still following the blue line (pullback scenario), but imo it has dropped a bit to much to be very convincing. There is still a chance for another move up, but i don't think it will be that strong. If we get towards the high of that possible wedge, i will close take profit and might even turn short there.注释
Unfortunately this one did not work out. Even worse, missing the entry for the bearish wedge. Poorly played :(Part of the game, up to the next. Bitcoin has taken all the attention lately :(

免责声明
这些信息和出版物并非旨在提供,也不构成TradingView提供或认可的任何形式的财务、投资、交易或其他类型的建议或推荐。请阅读使用条款了解更多信息。