
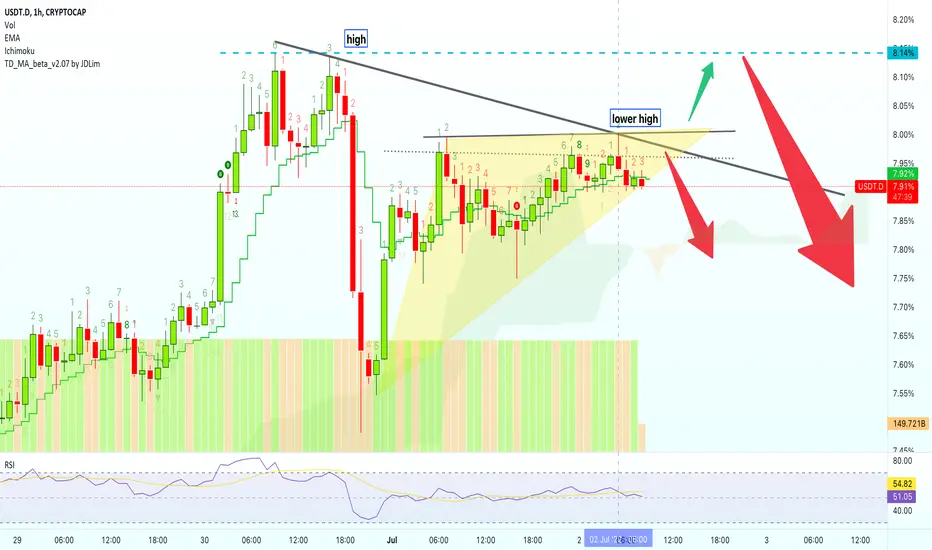
This is the chart that I have for USDT.D (Tether Dominance).
30-June sets the high and 2-July the lower high.
This is a short-term chart.
These are bearish signals but things can easily change.
Namaste.
30-June sets the high and 2-July the lower high.
This is a short-term chart.
- The marked candle 2-July '22 05:00 gives out a short/sell signals.
- The RSI trending lower to move below 50 gives out another bearish signal.
- We can also see a loss of the 10 sessions average support price at 7.92%...
These are bearish signals but things can easily change.
Namaste.

✅ Cryptocurrencies technical analysis & results
t.me/masteranandatrades/9279
✅ Stocks technical analysis
t.me/anandastocks
✅ Enjoyed the content? Join my PREMIUM channels for more... t.me/lamatrades/4 (since 2017)
t.me/masteranandatrades/9279
✅ Stocks technical analysis
t.me/anandastocks
✅ Enjoyed the content? Join my PREMIUM channels for more... t.me/lamatrades/4 (since 2017)
相关出版物
免责声明
这些信息和出版物并非旨在提供,也不构成TradingView提供或认可的任何形式的财务、投资、交易或其他类型的建议或推荐。请阅读使用条款了解更多信息。
✅ Cryptocurrencies technical analysis & results
t.me/masteranandatrades/9279
✅ Stocks technical analysis
t.me/anandastocks
✅ Enjoyed the content? Join my PREMIUM channels for more... t.me/lamatrades/4 (since 2017)
t.me/masteranandatrades/9279
✅ Stocks technical analysis
t.me/anandastocks
✅ Enjoyed the content? Join my PREMIUM channels for more... t.me/lamatrades/4 (since 2017)
相关出版物
免责声明
这些信息和出版物并非旨在提供,也不构成TradingView提供或认可的任何形式的财务、投资、交易或其他类型的建议或推荐。请阅读使用条款了解更多信息。