
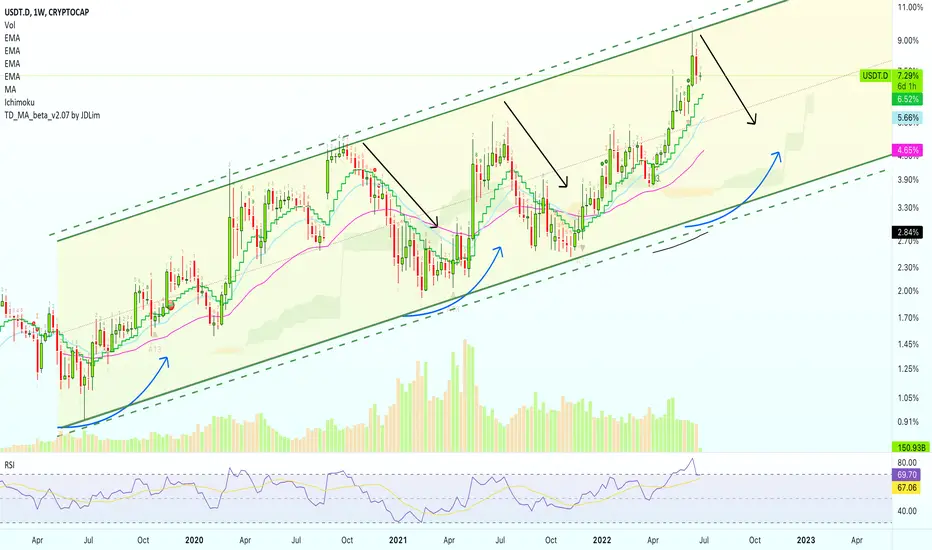
This is the long-term chart for Tether Dominance (USDT.D) and we are looking mainly at an ascending channel.
Each time the upper-band of the channel is hit we get a retrace/correction.
The upper-band being hit coincides with an overbought RSI.
An overbought RSI has always led to a strong correction.
Just yesterday/last week, USDT.D closed with the highest RSI value ever, signaling an overbought status.
It is only a matter of time before Bitcoin starts to grow; big, fast & strong.
I meant to say, it is only a matter of time before Tether Dominances drops.
Namaste.
Each time the upper-band of the channel is hit we get a retrace/correction.
The upper-band being hit coincides with an overbought RSI.
An overbought RSI has always led to a strong correction.
Just yesterday/last week, USDT.D closed with the highest RSI value ever, signaling an overbought status.
It is only a matter of time before Bitcoin starts to grow; big, fast & strong.
I meant to say, it is only a matter of time before Tether Dominances drops.
Namaste.

💯 Trading signals (results)
— Late 2026👇
t.me/masteranandatrades/9279
🔥 10-25X Leverage
—Trade-numbers:
t.me/masteranandatrades/9271
✅ PREMIUM &Content
—One-Time Payment
t.me/lamatrades/4 (🔝 since 2017)
— Late 2026👇
t.me/masteranandatrades/9279
🔥 10-25X Leverage
—Trade-numbers:
t.me/masteranandatrades/9271
✅ PREMIUM &Content
—One-Time Payment
t.me/lamatrades/4 (🔝 since 2017)
相关出版物
免责声明
这些信息和出版物并非旨在提供,也不构成TradingView提供或认可的任何形式的财务、投资、交易或其他类型的建议或推荐。请阅读使用条款了解更多信息。
💯 Trading signals (results)
— Late 2026👇
t.me/masteranandatrades/9279
🔥 10-25X Leverage
—Trade-numbers:
t.me/masteranandatrades/9271
✅ PREMIUM &Content
—One-Time Payment
t.me/lamatrades/4 (🔝 since 2017)
— Late 2026👇
t.me/masteranandatrades/9279
🔥 10-25X Leverage
—Trade-numbers:
t.me/masteranandatrades/9271
✅ PREMIUM &Content
—One-Time Payment
t.me/lamatrades/4 (🔝 since 2017)
相关出版物
免责声明
这些信息和出版物并非旨在提供,也不构成TradingView提供或认可的任何形式的财务、投资、交易或其他类型的建议或推荐。请阅读使用条款了解更多信息。