
USDT Dominance (USDT.D)
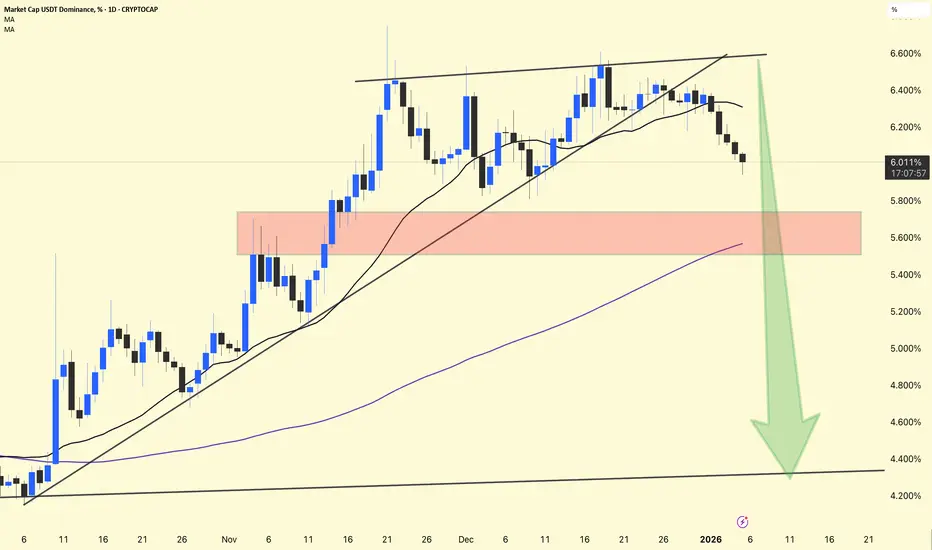
USDT.D has broken below the rising trendline & short-term MAs, showing weakness in stablecoin dominance.
Current level: ~6.01%
5.6% – 5.8% (highlighted red zone)
This is a critical support. If it fails, downside may accelerate.
Downside Targets (if support breaks):
5.2%
4.8%
Major support near 4.3% – 4.4% (long-term trendline)
Falling USDT.D = money moving from stablecoins into crypto
Supports BTC & altcoin bullish continuation
Higher probability of altcoin momentum if the breakdown continues
USDT Dominance is bearish, favoring risk-on sentiment. As long as it stays below the broken trendline, bullish pressure on crypto remains intact.
USDT.D has broken below the rising trendline & short-term MAs, showing weakness in stablecoin dominance.
Current level: ~6.01%
5.6% – 5.8% (highlighted red zone)
This is a critical support. If it fails, downside may accelerate.
Downside Targets (if support breaks):
5.2%
4.8%
Major support near 4.3% – 4.4% (long-term trendline)
Falling USDT.D = money moving from stablecoins into crypto
Supports BTC & altcoin bullish continuation
Higher probability of altcoin momentum if the breakdown continues
USDT Dominance is bearish, favoring risk-on sentiment. As long as it stays below the broken trendline, bullish pressure on crypto remains intact.

相关出版物
免责声明
这些信息和出版物并非旨在提供,也不构成TradingView提供或认可的任何形式的财务、投资、交易或其他类型的建议或推荐。请阅读使用条款了解更多信息。