
Second Point:
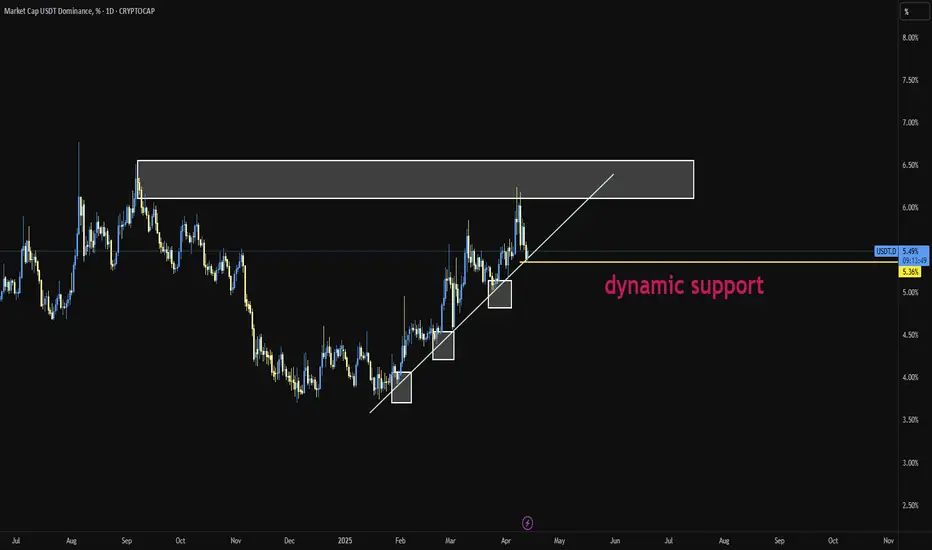
The USDT Dominance on the daily timeframe is showing the exact opposite behavior of Bitcoin. It has reached a supportive trendline which, for the past 3 months, has led to a reversal every time the index has touched it — pushing the market one level lower. And now, we're back at that critical zone again.
Will things be different this time?
This current touch appears to be a wave F, and perhaps we could even consider a potential wave G, which would imply one final leg up for USDT Dominance. However, there’s no certainty. There’s also the possibility that the trendline breaks, tether gets deployed, and the market becomes just a little — just a little — more pleasant.
We're literally on the edge right now, and this is where market pumps and dumps tend to occur — right in these key zones.
When will the situation become clear?
We have an important time zone coming up, and it’s likely that within the next couple of days, market makers will show their hand.
What do you think will happen?
Trendline breaks → Market pump
Trendline holds → Market dump ❤️

"🤖 Smart Trading Bots | 🚀 Advanced Market Analysis & Strategies | Helping You Trade Smarter, Not Harder!" ترید بات نبضار nabzar
免责声明
这些信息和出版物并非旨在提供,也不构成TradingView提供或认可的任何形式的财务、投资、交易或其他类型的建议或推荐。请阅读使用条款了解更多信息。
"🤖 Smart Trading Bots | 🚀 Advanced Market Analysis & Strategies | Helping You Trade Smarter, Not Harder!" ترید بات نبضار nabzar
免责声明
这些信息和出版物并非旨在提供,也不构成TradingView提供或认可的任何形式的财务、投资、交易或其他类型的建议或推荐。请阅读使用条款了解更多信息。